


Uncovering JAPA
Longer Crosswalk Distances Linked to More Collisions

summary
- Longer pedestrian crossing distances were consistently associated with a higher likelihood of collisions across: Paris, France; San Francisco; and Irvine, California.
- Citywide crossing data can help planners identify dangerous areas, including clusters of long crossings and routes that may pose risks for pedestrians.
- Low-cost interventions, such as curb extensions and pedestrian refuge islands, can shorten crossings and improve pedestrian safety.
"Look left, right, left again. OK." For children growing up in the United States, learning to safely cross the street is a rite of passage. But crossing a wide road with four or more lanes often requires looking all over multiple times before cautiously stepping into the street. You instinctively feel the extra level of danger, even when the street is empty.
The distance from sidewalk edge to sidewalk edge at pedestrian crossings (like crosswalks) is known as crossing distance. Researchers know it affects pedestrian safety and behavior, but crossing distance has seldom been quantified at a broader city-wide scale. In "Multiscale Analysis of Pedestrian Crossing Distance" (Journal of the American Planning Association, Vol. 92, No. 2), Marcel E. Moran and Debra F. Laefer identified granular patterns of where people could cross the street across three cities.
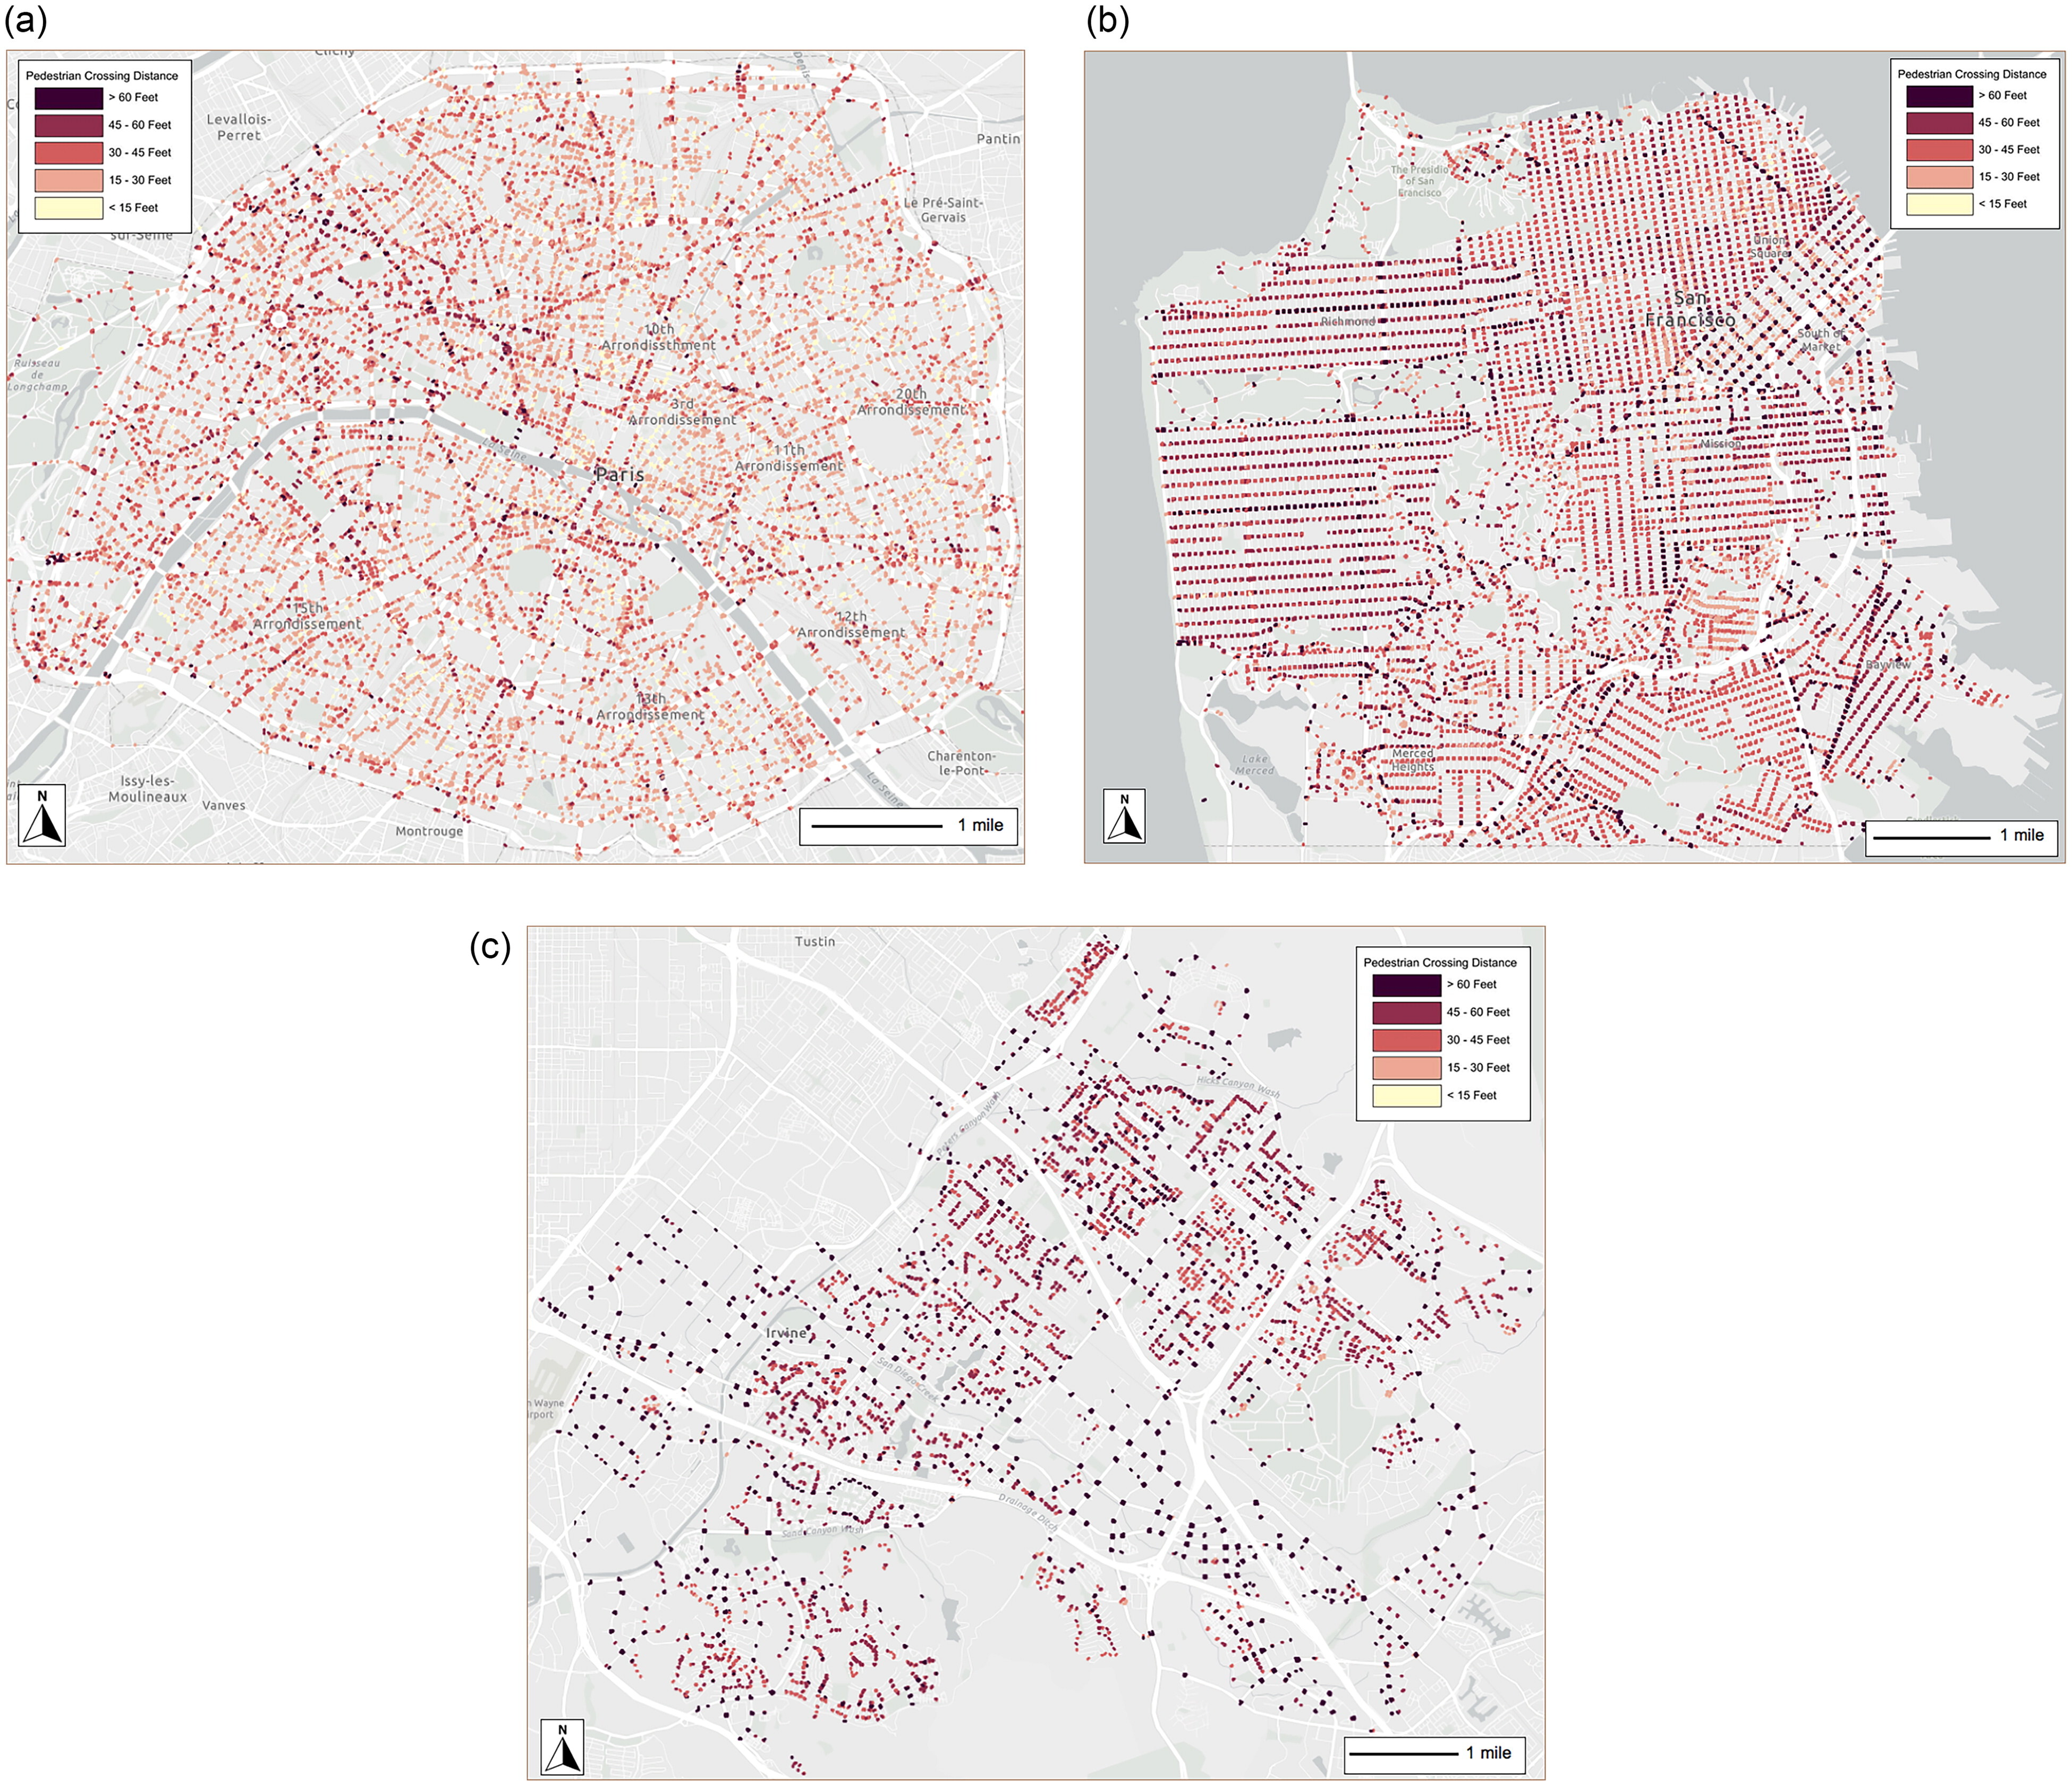
Figure 4: (a) Pedestrian crossing distance in Paris, France. This view excludes crossings in two large parks on Paris’s eastern and western end, Bois de Vincennes and Bois de Boulogne. (b) Pedestrian crossing distance in San Francisco. This view excludes crossings on Treasure Island. (c) Pedestrian crossing distance in Irvine, California. Crossings within identified gated communities have been excluded. (Credit: Authors)
European Success
While pedestrian fatality rates have increased in the U.S. since 2011, Europe's rate decreased by 20% between 2010 and 2018. The study authors wondered whether crossing distances might explain those differing safety outcomes.
They mapped out 49,000 pedestrian crossings in Paris, France; San Francisco; and Irvine, California. By matching the crossings with recent pedestrian-vehicle collision data, the study showed that longer crossing distances correlated with a higher likelihood of collisions.
| Paris (France) | San Francisco (CA) | Irvine (CA) | |
|---|---|---|---|
| Spatial extent (mi2) | 41.00 | 46.90 | 65.92 |
| Population | 2,119,682 | 807,774 | 313,705 |
| Population density (people per sq. mile) | 51,700 | 17,223 | 4,759 |
| Commute mode share, walking (%) | 16 | 9 | 3 |
| Commute mode share, driving alone (%) | 43 | 29 | 59 |
Table 1: Characteristics of pedestrian crossing distance case studies. (Credit: Authors).
The study relied on a combination of crowdsourced pedestrian infrastructure data from OpenStreetMap and satellite imagery from Google Earth. The combined layers, supplemented with manual spot-checking, created a more accurate map of crossing distances.
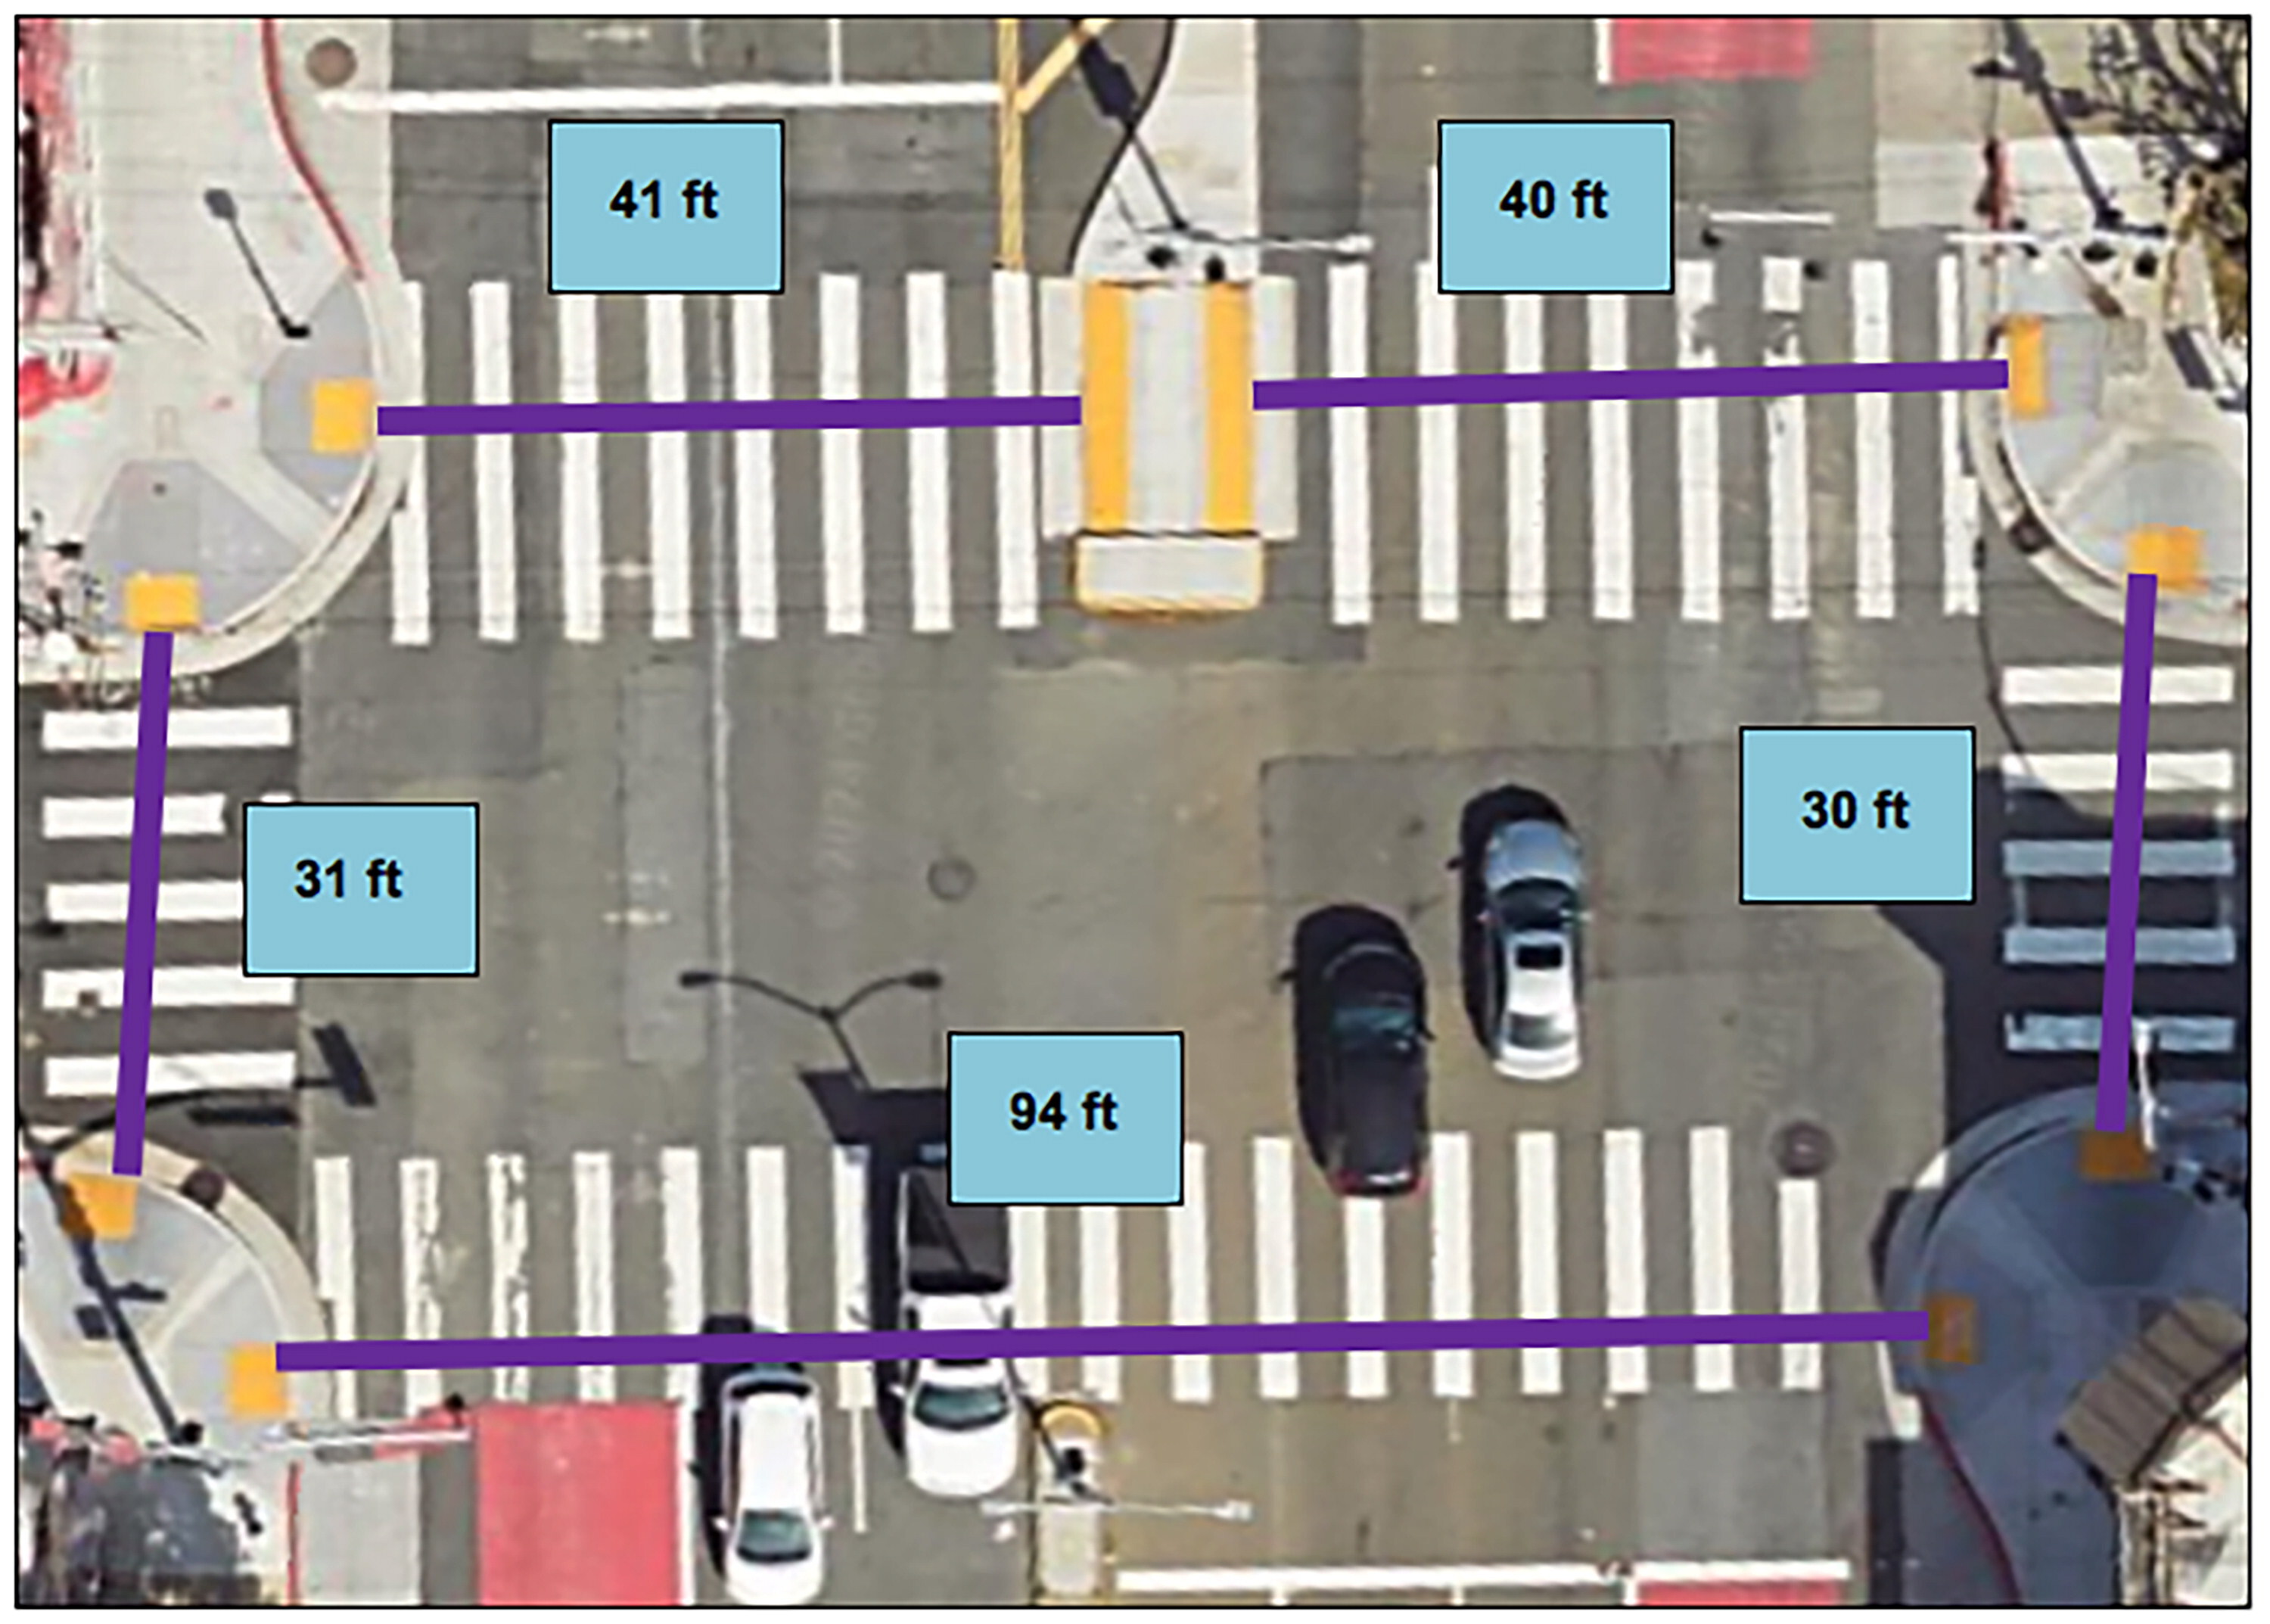
Figure 2: Pedestrian crossings at a San Francisco intersection labeled using satellite imagery drawn from Google Earth. Crossings between sidewalks and pedestrian refuge islands are treated as distinct. (Credit: Authors).
Longer Crossings Are More Dangerous
Looking across three cities allowed the authors to identify street characteristics and patterns of dangerous pedestrian crossings. In each city, crossings where recent collisions occurred were longer, on average, than crossings overall. This ranged from a 15% increase in Paris to a 23% increase in San Francisco and 43% in Irvine. Specifically, for every 1-foot increase in crossing distance, the probability that a collision occurred increased by 0.8% in Paris, 2.11% in San Francisco, and 1.8% in Irvine.
Beyond this correlation, the authors note unique, city-specific patterns in crossing distance. While Paris had very few crossings 70 feet or more, San Francisco had multiple corridors with strings of long crossings. Irvine had crossings of 70 feet or more scattered throughout.
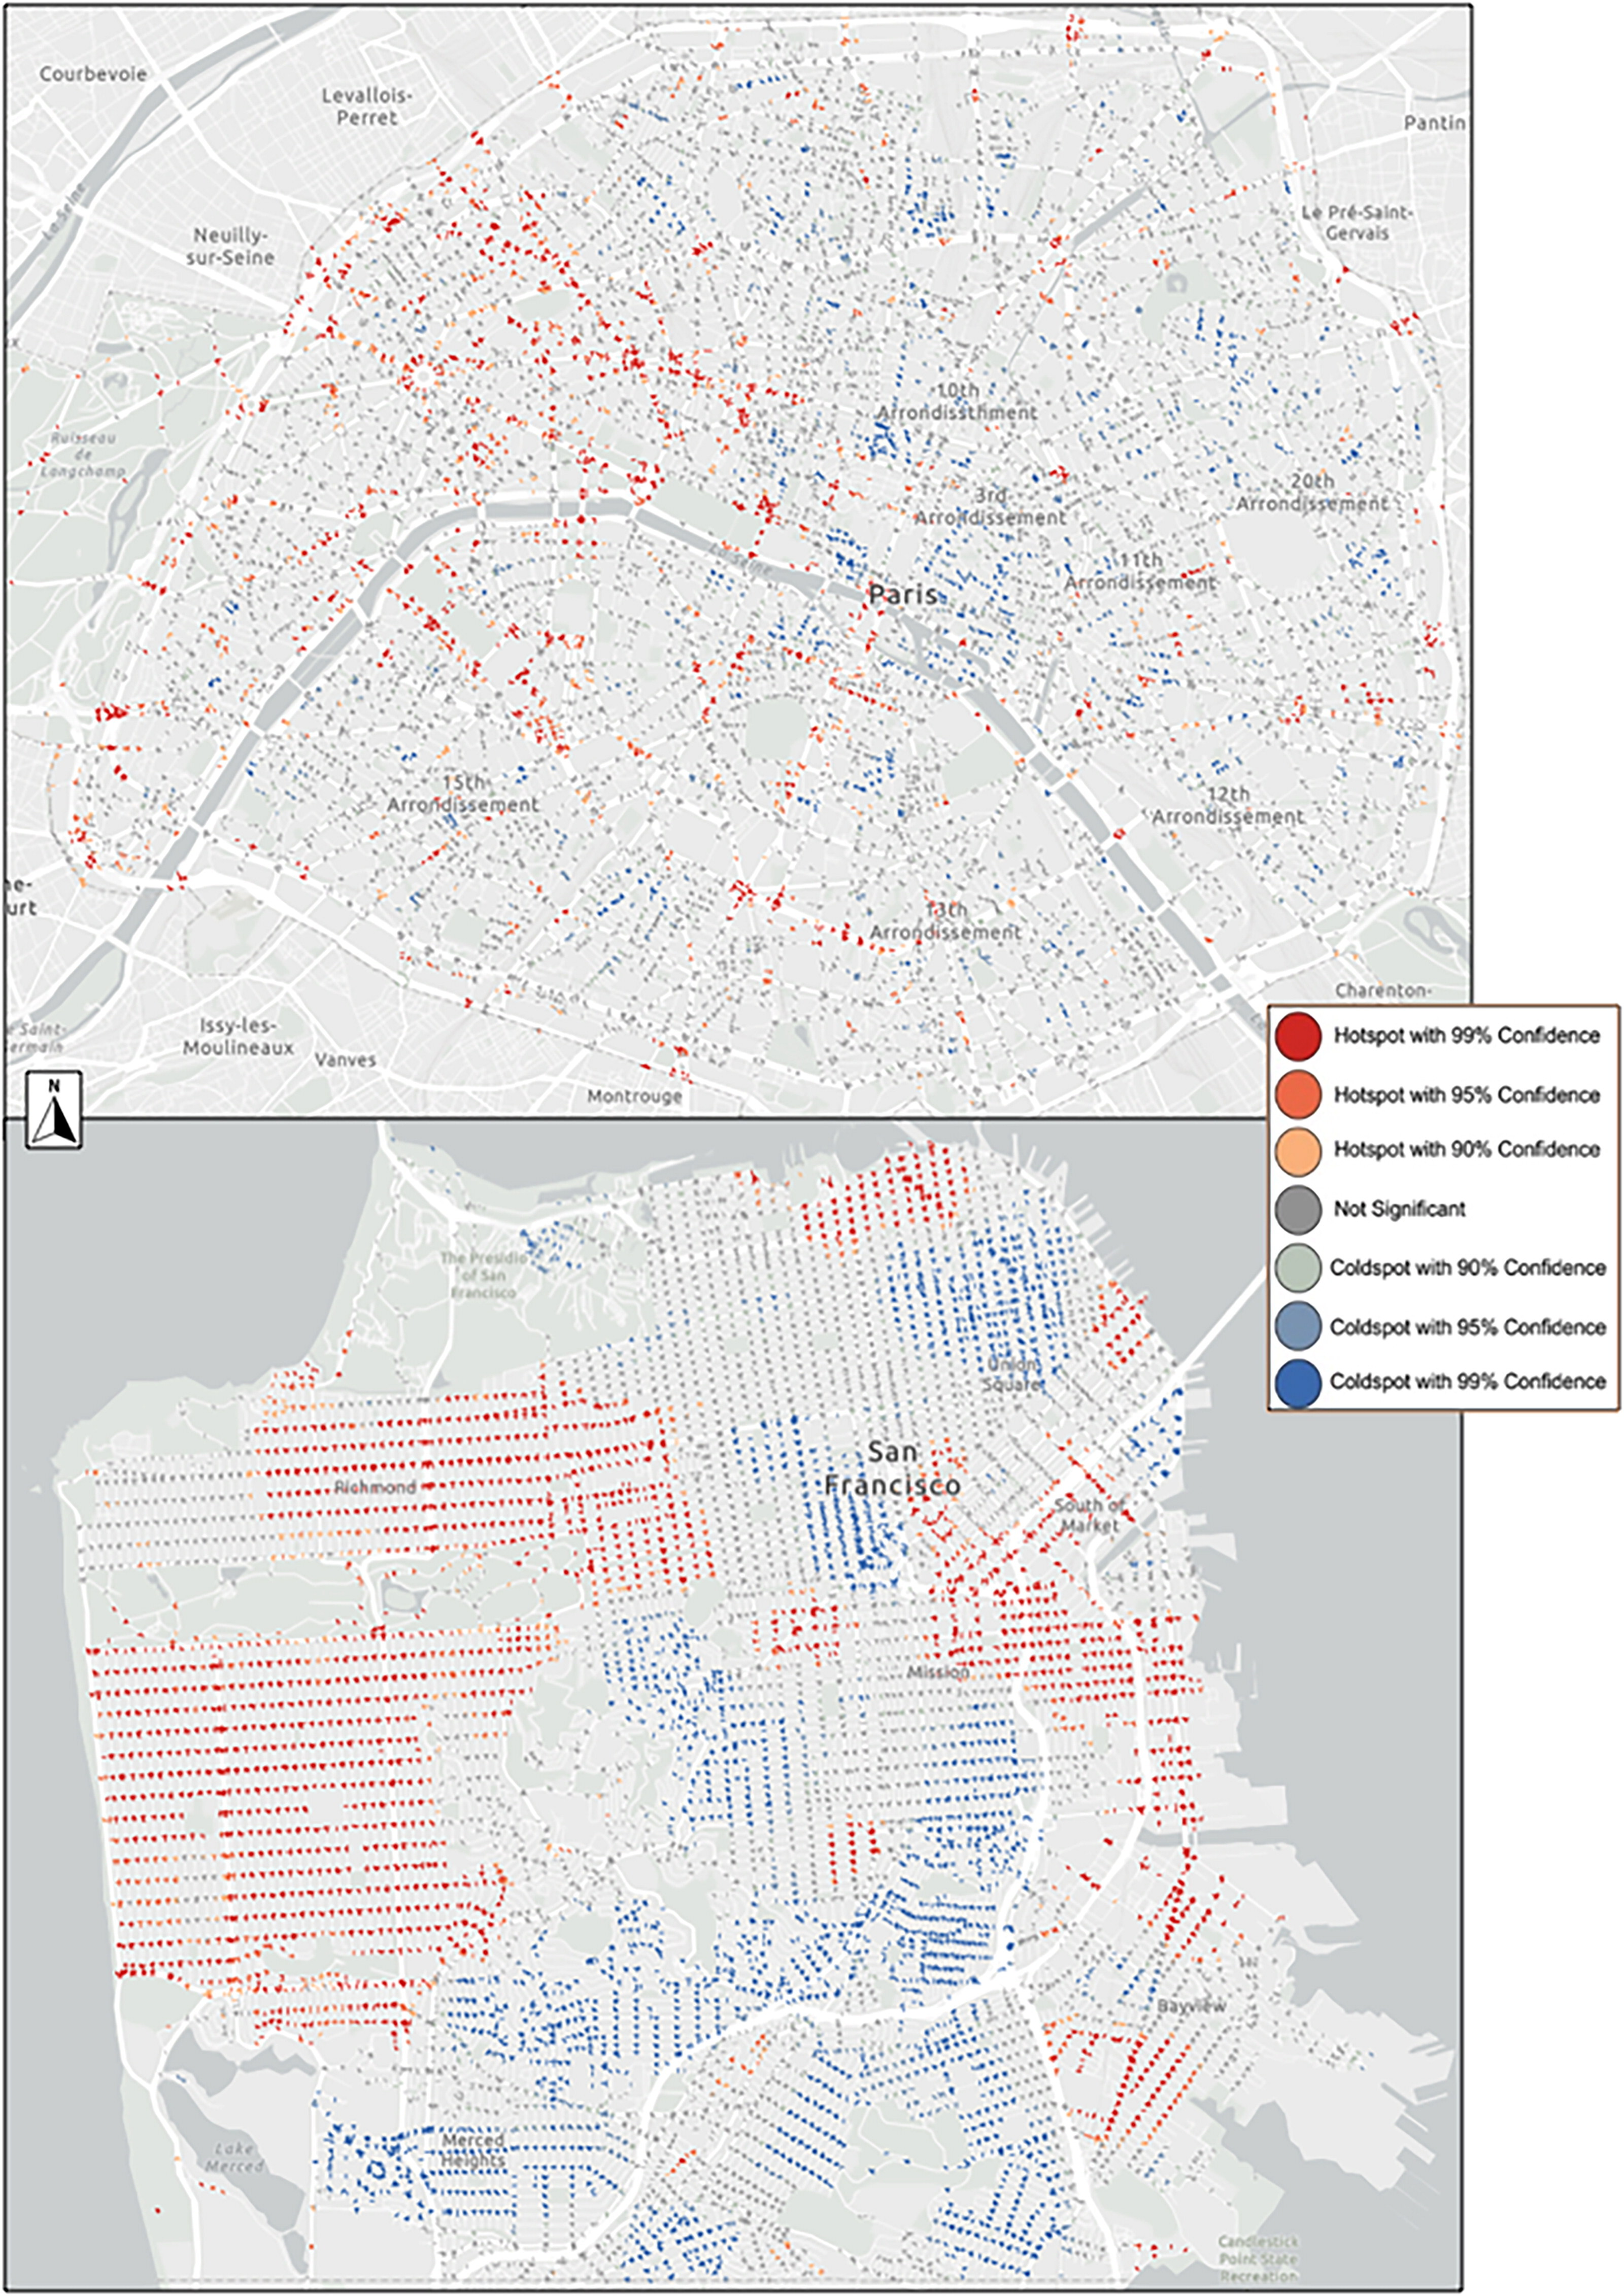
Figure 8: Hotspot analysis of pedestrian crossing distance in Paris (top) and San Francisco (bottom). Areas of darkest hues represent clusters of longer or shorter crossings. Maps are set to different scales. (Credit: Authors).
From Maps to Strategies
Paris had the shortest average crossing distance (26 feet) and very few long crossings. The authors point toward Paris's narrow streets and its robust investment in curb extensions and refuge islands midway across the street. Irvine, the least dense city of the three, had a 58-foot average crossing distance, including a fifth of all crossings measuring 70 feet or more. San Francisco fell between the two. Its average crossing distance was 43 feet. Like Paris, San Francisco has decreased crossing distances with traffic-calming investments.
The authors' approach pinpoints long crossings as a key to improving safety outcomes. Modular interventions, such as refuge islands and sidewalk extensions, were effective in Paris and San Francisco. To identify priority locations, planners can set a locally relevant target for crossing distances.
These methods can identify clusters of crossings with similar distances. This offers a more nuanced perspective on a city's pedestrian environment. Identifying crossing-distance hotspots moves beyond individual intersections or corridors to consider long-crossing neighborhoods or routes to school that can be addressed collectively.
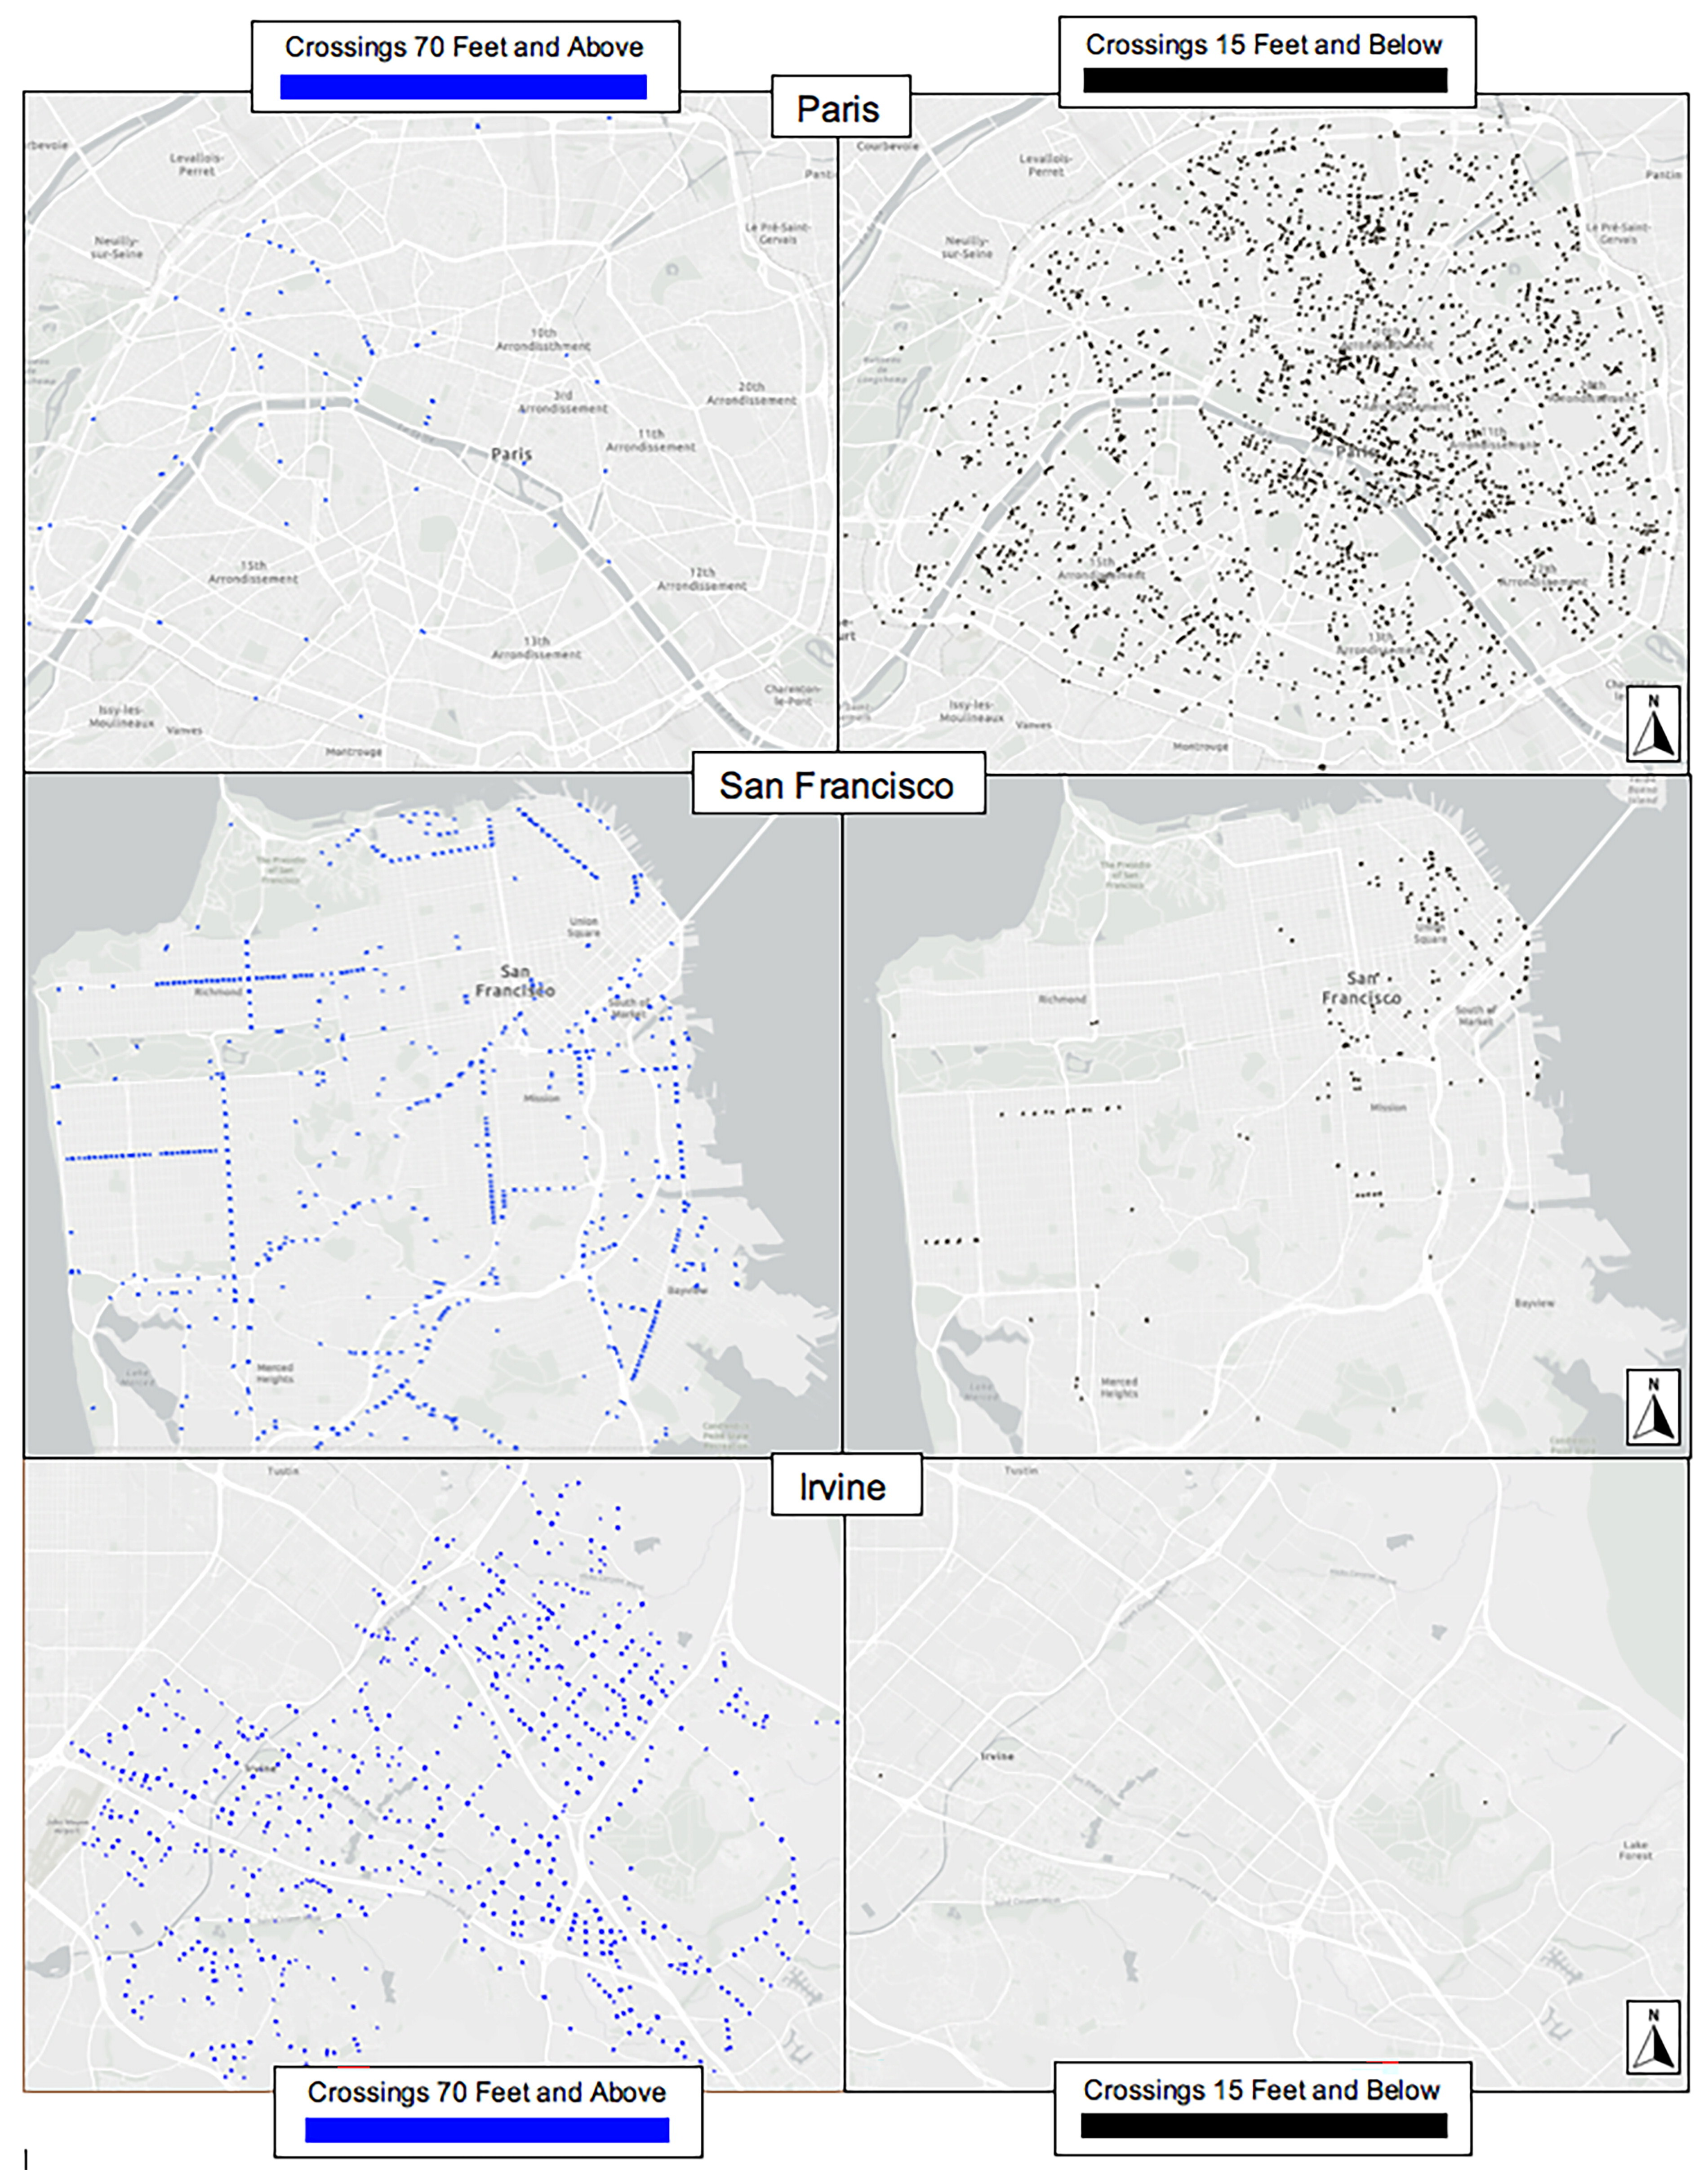
Figure 5: Paris, San Francisco, and Irvine pedestrian crossings 70 feet and longer (left) and Paris, San Francisco, and Irvine pedestrian crossings 15 feet and shorter (right). Maps are set to different scales. (Credit: Authors).
Key Takeaways
-
Citywide data on pedestrian crossings empowers transportation planners to identify dangerous areas and target interventions.
-
Prioritizing cars in city planning degrades the pedestrian environment.
-
Dangerous trends can be mitigated by low-tech investments like sidewalk extensions and refuge islands.
Top image: Photo by iStock/Getty Images Plus/ davit85