


Planning for Apartments
PAS Report 139
Historic PAS Report Series
Welcome to the American Planning Association's historical archive of PAS Reports from the 1950s and 1960s, offering glimpses into planning issues of yesteryear.
Use the search above to find current APA content on planning topics and trends of today.
More From APA

Interested in Housing? You Might Also Like:
Data-Driven Housing Assessments and Action Plans, Part 2: Analytical Techniques and Taking Action
This PAS Memo describes techniques for analyzing publicly available housing data and offers recommendations for programs, policies, and partnerships to take action based on the results of housing needs assessments.

|
AMERICAN SOCIETY OF PLANNING OFFICIALS 1313 EAST 60TH STREET — CHICAGO 37 ILLINOIS |
|
| Information Report No. 139 | May 1960 |
Planning for Apartments
Download original report (pdf)
In recent years, we have witnessed a renewed interest in the apartment house. There are many reasons for this. Some families and individuals would rather rent than own their living quarters. There are others who simply do not want the responsibility of maintaining any more than their interior living space. Still others seek an urban atmosphere in a location in which convenient rapid transit minimizes their travel time. Apartments may well be the answer for persons with such demands.
Nevertheless, in the postwar period, the greatest increment to our housing supply, both in absolute and relative terms, has been in single-family dwellings. A primary factor in this trend has been the favorable financial arrangement offered to owners of single-family dwellings. This has been encouraged by governmental action. There is no denying the widespread appeal of the detached home for a host of psychological, sociological and practical reasons. The single-family home on its own plot of ground provides privacy, access to fresh air and sunlight, the potential for self-expression, and it is said to be the best place in which to rear children.
It is now apparent that the suburban movement has not been an unmixed blessing. We are all familiar with the sprawling explosion of our metropolitan areas; raw land has been consumed at an alarming rate. Speculative building has filled up vast acreage with a motif that is, to say the least, monotonous. The costs of sprawl are passed on to the community, for it is the suburban taxpayer who must support newly constructed facilities such as schools, water and sewer lines, playgrounds and roads.
The apartment is beginning to emerge as a realistic alternative to the single-family detached dwelling. This is not to say that apartment living will appeal to more than a fraction of the population, but there is every indication that a substantial demand exists. As the design of individual apartments and siting improves, there will not be such a disparity between the benefits attributed to single-family and multi-family dwellings. High-density living, at least for a portion of the population, seems to be in order.
Purpose and Scope
The purpose of this report is to explore the physical, economic and social factors which arise in considering the construction of multi-family residences in a community. It is written in response to an increasing number of inquiries that ASPO Planning Advisory Service has received on this subject. These questions have not been limited to any region of the nation. Many of them have been received from suburban communities that have had no previous experience with apartments.
The report will examine the legacy of multi-family residences that has shaped current attitudes toward apartment living. It will explore recent construction trends and the market for this kind of dwelling unit. Zoning provisions for multi-family uses will form the core of the report. There will be an appraisal of what the community can do to encourage the best type of apartment buildings within its boundaries.
The discussion of zoning will be limited to provisions that are explicitly permissive with regard to land uses and dimensional requirements. Undoubtedly, many multi-family projects are built under the broad "planned development" provisions that require approval by the legislative or some administrative body. Similarly, there has been some discussion of floating zones for apartment districts. The merits of this proposal will not be discussed except to point out that the exercise of locational determinacy by the community is, to some degree, lost. To discourage land speculation, floating apartment zones might be justified if only a limited amount of apartments are expected to be built. However, if either the "planned development" or the floating zone is used to accommodate apartment developments, some of the factors mentioned hereafter will be relevant.
The Apartment Legacy
Apartment houses have existed from ancient times. As Babylon grew, dwellings increased in height and in the number of inhabitants they housed. The first building-height limits that we know of were imposed by the Emperor Augustus. Residential structures were restricted to a height of 70 feet. Excavation in Ostia, the port of Rome, has enabled archeologists to reconstruct the form of these early apartments. The House of Diana, in Ostia, was a multi-family five-story structure of brick construction with a handsome facade. Others were of wood and constituted a serious fire hazard.
During the agrarian civilization of the Dark Ages, urban apartments all but disappeared. With the revival of trade in late medieval times, town life began again with the clustering of workshops and dwellings at defensible points along trade routes. Lewis Mumford in the Culture of Cities explains how these dwellings were subdivided to accommodate many families, leaving us with the impression of intense overcrowding in many European cities and towns.

Table 1:
Dwelling Units by Type
| Type of dwelling | USA | SMA | Urban places of more than 100,000 | |||
| Number (thousand) | % of total | Number (thousand) | % of total | Number (thousand) | % of total | |
| 1 unit, detached | 29,116 | 63.4 | 12,551 | 48.9 | 4,404 | 32.5 |
| 1 unit, attached | 1,210 | 2.6 | 996 | 3.9 | 791 | 5.8 |
| 1 & 2 unit, semi-detached | 1,589 | 3.5 | 1,119 | 4.4 | 607 | 4.5 |
| 2 unit | 5,302 | 11.5 | 3,658 | 14.2 | 2,224 | 16.4 |
| 3 & 4 unit | 3,374 | 7.3 | 2,592 | 10.1 | 1,778 | 13.1 |
| 5 to 9 unit | 2,138 | 4.6 | 1,768 | 6.9 | 1,318 | 9.7 |
| 10 to 19 unit | 1,085 | 2.4 | 970 | 3.8 | 718 | 5.3 |
| 20 to 49 unit | 1,184 | 2.6 | 1,147 | 4.5 | 1,026 | 7.6 |
| 50 units or more | 671 | 1.5 | 666 | 2.6 | 627 | 4.6 |
| Total | 45,983 | 25,626 | 13,588 | |||
| 3 units or more | 8,452 | 18.4 | 7,133 | 27.8 | 5,468 | 40.3 |
Source: U.S. Bureau of the Census. 1950 Census of Housing: U.S. Summary, General Characteristics. Washington, D. C., Government Printing Office, 1952.
Speculative building of multi-family structures accompanied the industrial revolution in Europe and the United States. The dismal heritage of early industrialism is still to be seen in the factory towns of New England and in many of the large industrial cities of the United States.
Within the United States, there are vast differences in the types of housing found in our cities. The 1950 census of housing reveals to what extent multi-family dwellings make up the housing supply in the nation. As Figure 1 suggests, the census inventory is based on the relationship of one structure to another and the number of units within each structure. In Table 1, all residential buildings with three or more dwelling units are classified as apartments. Trailers used as dwelling units are not included.
These figures indicate:
1. About 84 per cent of the apartments in the nation are found in the standard metropolitan areas; nearly 77 per cent of the total are found in urban places of more than 100,000 persons.
2. Apartments make up 27.8 per cent of the total housing supply in the standard metropolitan areas and 40.3 per cent of the housing supply in urban places of more than 100,000 persons.
These figures represent an accumulation of dwellings over many decades. They obscure the fact that there are some good examples and a great many poor examples of each housing type; but it is this accumulation that generates current attitudes about the various kinds of housing.
The census figures also reveal regional differences in the housing supply. The figures in Table 2 are reflective of the attitudes toward housing types in the various parts of the country. Using the proportion of housing types in the nation as a norm, the underlined figures in Table 2 indicate predominant regional housing types.
Table 2:
Percentage of Dwelling Unit Types in Each Region
| Type of dwelling | New England | Middle Atlantic | North East Central | West North Central | South Atlantic Central | East South Central | West South Central | Mountain | Pacific |
| 1 unit, detached | 49.3 | 38.8 | 64.1 | 74.7 | 68.1 | 80.0 | 79.3 | 74.4 | 69.7 |
| 1 unit, attached | .8 | 7.0 | .8 | 1.1 | 4.2 | 1.0 | 1.0 | 1.5 | 1.3 |
| 1 & 2 unit, semi-detached | 2.8 | 6.4 | 2.2 | 1.4 | 3.4 | 2.8 | 3.3 | 3.3 | 3.4 |
| 2 unit | 20.4 | 15.3 | 14.2 | 9.4 | 9.3 | 8.9 | 7.5 | 6.8 | 6.1 |
| 3 & 4 unit | 17.9 | 9.3 | 7.6 | 6.0 | 5.7 | 4.2 | 4.2 | 5.3 | 6.1 |
| 5 to 9 unit | 8.0 | 6.7 | 4.6 | 3.5 | 3.4 | 2.2 | 2.6 | 3.9 | 5.4 |
| 10 to 19 unit | 2.5 | 4.2 | 2.3 | 1.4 | 1.7 | .8 | 1.1 | 1.8 | 3.0 |
| 20 to 49 unit | 1.5 | 7.1 | 2.2 | 1.1 | .9 | .3 | .3 | 1.2 | 2.7 |
| 50 units or more | .4 | 4.9 | 1.1 | .5 | .6 | .1 | .1 | .2 | .8 |
| 3 units or more | 30.3 | 32.2 | 17.8 | 12.5 | 12.3 | 7.6 | 8.3 | 12.4 | 18.0 |
Source: 1950 Census of Housing: U. S. Summary, General Characteristics.
Several conclusions about the distribution of housing in the United States can be drawn from this data:
1. Single-family detached dwellings are the predominant housing type in all regions of the country except the heavily urbanized New England and Middle Atlantic states.
2. Two-family dwellings exceed the national norm in New England, the Middle Atlantic and the Northeast Central regional census divisions.
3. Semi-detached single-family homes are prevalent along the Atlantic seaboard, except in New England. Many single-family attached dwellings (row houses) are found in the Middle Atlantic states. Large numbers of these housing types are found in the New York area, Washington (D.C.), Baltimore, Philadelphia and other smaller cities in this region.
4. The ratio of apartments to the total housing supply is very high in the Middle Atlantic states and New England. The Northeast Central and Pacific divisions are close to the national ratio. In all other regional census divisions, the ratio is below the national norm.
5. Apartments of all types characterize the Middle Atlantic states. There is a preponderance of three- and four-unit structures in New England. The five- to 49-unit buildings characterize the Pacific states. The Northeast Central division has only a slight excess of three- and four-unit structures and somewhat resembles the New England pattern.
Table 3 lists the metropolitan areas in the country that are most heavily "apartmentalized." The "apartmentalization index" is simply the percentage of apartments to the total housing supply in each metropolitan area. The list in Table 3 includes the 25 largest metropolitan areas and all other metropolitan areas in which apartments exceed the norm of 27.8 per cent as derived in Table 1. Where an X appears in the table or where the percentage of a particular apartment size is underlined, this type of housing exceeds the norm for the metropolitan areas as set forth in Table 1.
Apartments dominate New York City. In Chicago, apartments seem to be superimposed on a pattern of two-family dwellings, unlike other cities in the east-west industrial belt from New England to the Midwest. The great apartment buildings of Washington are superimposed on a pattern of row houses and semi-detached dwellings that are found in Philadelphia and Baltimore. Boston resembles the pattern of other New England cities with large numbers of two-family houses and small apartment buildings of three to nine units. The San Francisco–Oakland area is a good example of cities in the West where apartments are superimposed on a pattern of single-family detached dwellings. Semi-detached single-family dwellings are much in evidence in the South.
Table 3:
Highly "Apartmentalized" Metropolitan Areas
| SMA | SMA Rank 1959 | Apt. Index (3 units or more) | 1 unit, de- tached |
1 unit, at- tached |
1 & 2 unit, semi- de- tached |
2 unit | 3 & 4 unit | 5 to 9 unit | 10 to 19 unit | 20 to 49 unit | 50 units or more |
| New York | 1 | 56 | 11 | 10 | 8 | 16 | 11 | ||||
| Chicago | 2 | 45 | X | 15 | 11 | 7 | 8 | 4 | |||
| Washington | 11 | 40 | X | X | 10 | 10 | 7 | 6 | 7 | ||
| Boston | 6 | 40 | X | 23 | 10 | 3 | 4 | 1 | |||
| Providence | 19 | 37 | X | 26 | 8 | 2 | - | - | |||
| San Francisco-Oakland | 7 | 33 | X | 12 | 6 | 5 | 1 | ||||
| Cincinnati | 15 | 33 | X | 16 | 12 | 2 | 2 | 1 | |||
| Kansas City | 17 | 28 | X | 9 | 9 | 5 | 4 | 2 | |||
| SMA Average | |||||||||||
| St. Louis | 9 | 28 | X | 15 | 7 | 3 | 1 | 1 | |||
| Cleveland | 10 | 27 | X | 11 | 6 | 4 | 3 | 1 | |||
| Minneapolis-St. Paul | 13 | 25 | X | X | 8 | 6 | 5 | 5 | 1 | ||
| New Orleans | 22 | 25 | X | X | 11 | 8 | 5 | 1 | - | ||
| Atlanta | 23 | 24 | X | X | 10 | 7 | 5 | 2 | - | ||
| Seattle | 20 | 23 | X | 4 | 5 | 4 | 6 | 3 | |||
| Milwaukee | 16 | 23 | X | 10 | 5 | 3 | 3 | 1 | |||
| Los Angeles | 3 | 22 | X | X | 8 | 5 | 5 | 4 | 1 | ||
| Louisville | 25 | 21 | X | 11 | 6 | 3 | 1 | - | |||
| Detroit | 5 | 19 | X | X | 7 | 4 | 2 | 4 | 2 | ||
| Pittsburgh | 8 | 19 | X | X | X | 10 | 5 | 2 | 1 | 1 | |
| Buffalo | 14 | 19 | X | 11 | 4 | 2 | 1 | 1 | |||
| Baltimore | 12 | 18 | X | X | 10 | 5 | 1 | 1 | 1 | ||
| Philadelphia | 4 | 17 | X | X | 8 | 6 | 1 | 1 | 1 | ||
| Portland | 21 | 17 | X | 4 | 4 | 4 | 3 | 1 | |||
| Dallas | 24 | 15 | X | X | 7 | 5 | 2 | 1 | - | ||
| Houston | 18 | 13 | X | X | 6 | 5 | 2 | - | - | ||
| Smaller Cities Exceeding SMA Average | |||||||||||
| Fall River | 124 | 55 | X | 35 | 17 | 2 | - | 0 | |||
| Manchester, N.H. | 160 | 46 | X | 22 | 14 | 7 | 3 | - | |||
| Worcester | 66 | 46 | X | 34 | 9 | 3 | 1 | - | |||
| Waterburg | 110 | 43 | X | 28 | 11 | 4 | 1 | - | |||
| Lawrence | 134 | 43 | X | 29 | 11 | 2 | 1 | 0 | |||
| Hartford | 47 | 43 | X | 17 | 14 | 7 | 4 | 1 | |||
| New Bedford | 123 | 42 | X | 29 | 10 | 2 | - | - | |||
| New Haven | 71 | 36 | X | 20 | 8 | 4 | 2 | 1 | |||
| Springfield-Holyoke | 42 | 35 | X | 14 | 12 | 6 | 3 | - | |||
| Portland, Me. | 136 | 34 | X | 15 | 10 | 4 | 3 | 1 | |||
| Bridgeport | 72 | 33 | X | 17 | 9 | 4 | 3 | 1 | |||
| Lowell | 127 | 31 | X | 13 | 12 | 4 | 2 | 0 | |||
| El Paso | 95 | 28 | X | X | 8 | 10 | 7 | 4 | - | ||
Source: 1950 Census of Housing: U.S. Summary, General Characteristics.
These statistics begin to take on meaning when they are related to specific cities. In Boston, one sees vast stretches of wooden three-deckers with one or two flats on each floor. In the northern Midwest, there are not so many of these old wooden structures, but the ratio of two-family dwellings is higher. Row houses and semi-detached dwellings are the rule in Philadelphia and Baltimore. The West, of course, with a more open type of land development is the region of the detached dwelling.
One can theorize that a process of succession in types of housing occurs as cities grow. Our older cities have already experienced several layers of development. At each stage there seems to be a popular form of residential development and from each period there remains a residue. This ecological process is demonstrated most clearly in Manhattan Island: detached houses have all but disappeared; a great many brownstones still stand, but they are slowly giving way to high-rise, high-density apartment development. In most cities, however, the earlier stages of development are still very much in evidence.
The purpose of this exposition is to demonstrate what differences exist in the housing supply from one region to another and in the major cities of the country. An examination of the existing housing supply in a locality will provide an indication of the types of residences to which people are accustomed. The existence of slum tenements might suggest a widespread desire to escape to single-family dwellings in the suburbs as soon as means are available. Alternatively, it could indicate a need to replace the outmoded tenements with apartments built to modern specifications. The absence of apartments may reveal the need to construct some of these structures in order to satisfy existing demand. The first step in considering apartments for a locality should be to make an inventory of the existing supply because this may reveal the housing needs of a community as well as the local attitudes.
But, familiarity with a type of housing is no indication that it is desired by the occupants. This is most apparent in the case of slum tenements. Whether decent apartments or some other form of housing should replace slum apartments is a question that can best be answered in the market place.
Recent Trends
Since 1956, there has been a crescendo of apartment building activity which has reached a peak unparalleled since the housing boom of the 1920's. Multi-family housing starts since World War II are illustrated in Figure 2a. The total is broken down into categories according to ownership. Public housing starts are represented by the upper portion of each bar; private starts are indicated by the lower portion of the bar.
Figure 2b indicates apartment dwelling unit starts as a percentage of total dwelling unit starts in the postwar period. The upsurge since 1956 has reached a peak which was exceeded in the postwar period only in 1949 when public housing and FHA-inspected housing constituted a very large portion of the starts.
According to Miles Colean, as reported in the May 1960 issue of Architectural Forum, the upsurge in apartment construction is expected to continue through the 1960's with an average of 250,000 units being added in each of the first five years and 360,000 in each of the last five years of the decade. It is estimated that 3,000,000 apartments will be built during the 10 years — twice as much as during the previous boom of the 1920's.
Figure 2a. Apartment dwelling units (3 or more DU per structure) started from 1946 to 1959 (thousands)

Figure 2b. Percentage of dwelling unit starts that were in apartment structures
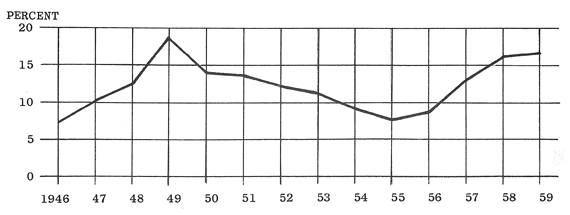
Source: Thirteenth Annual Report of the Housing and Home Finance Agency, 1959.
Statistics for new construction can be deceptive since, in many areas, this activity is being accompanied by large-scale removal of apartments from the housing inventory. The Bureau of the Census has charted components of change from 1950 to 1956 in the 1956 National Housing Inventory during this period. Some of the figures for the nation and the four census regions are given in Table 4. Dwelling units are created by conversions, merger, new construction, and other means such as a change from uses that are not previously dwelling units (for example, from a sleeping room to a one-room dwelling unit). Dwellings are removed through demolition, conversion and merger (a bookkeeping entry) and other means.
Table 4:
Components of Change, 1950-1956
| Total dwelling units (thousands) | USA | North East | North Central | South | West |
| Created | 13,888 | 3,084 | 3,331 | 4,669 | 2,805 |
| Removed | 4,533 | 934 | 1,234 | 1,689 | 676 |
| Net increase | 9,355 | 2,150 | 2,097 | 2,980 | 2,129 |
| New construction | 10,920 | 2,364 | 2,425 | 3,770 | 2,362 |
| Dwelling units in structures with 5 or more D.U.s (thousands) | USA | North East | North Central | South | West |
| Created | 1,169 | 455 | 209 | 254 | 251 |
| Removed | 682 | 209 | 247 | 148 | 77 |
| Net increase | 487 | 246 | 38 | 106 | 174 |
| New construction | 758 | 330 | 76 | 181 | 171 |
| Per Cent of new construction in apartments | 6.9 | 14.0 | 3.1 | 4.9 | 7.2 |
(Only structures with 5 dwelling units or more are considered apartments)
Source: Components of Change 1950 to 1956, 1956 National Housing Inventory, Vol. I, Part 1, Bureau of the Census, U.S. Department of Commerce.
Since World War II, single-family housing has dominated new construction and in no region of the country are apartments being built in the same proportion as they now exist. The figures indicate that the greatest construction activity and increase in the apartment supply occurred in the North East. In spite of new construction, supply actually decreased in the North Central region. The supply is increasing in the West due to the low rate of removal. Table 5 demonstrates that the major portion of recent apartment building construction activity is concentrated in 15 metropolitan areas.
Table 5:
Leading Standard Metropolitan Areas In The Issuance Of Building Permits For Apartment Units
| Area | 1959 | Rank | 1958 | Rank |
| New York-Northeastern N.J. | 47,640 | 1 | 36,674 | 2 |
| Los Angeles | 36,650 | 2 | 38,321 | 1 |
| Washington, D.C. | 11,505 | 3 | 9,740 | 3 |
| Chicago | 11,388 | 4 | 8,838 | 4 |
| San Francisco-Oakland | 10,326 | 5 | 8,602 | 5 |
| San Diego | 5,265 | 6 | 5,580 | 7 |
| Seattle | 4,188 | 7 | 2,989 | 10 |
| Philadelphia | 3,712 | 8 | 2,278 | 13 |
| Phoenix | 3,703 | 9 | 3,101 | 9 |
| Atlanta | 3,664 | 10 | 2,152 | 14 |
| Miami | 3,608 | 11 | 6,369 | 6 |
| Minneapolis-St. Paul | 3,502 | 12 | 3,385 | 8 |
| Cincinnati | 3,058 | 13 | 1,342 | 19 |
| Denver | 2,098 | 14 | 2,717 | 11 |
| Milwaukee | 2,048 | 15 | 1,861 | 17 |
Source: House and Home, June 1960.
New York, where the greatest concentration of apartments already exists, is continuing to build at a rapid pace. Los Angeles, traditionally not an apartment city, is a close second in recent building activity. Other western cities such as San Diego and Phoenix are displaying similar patterns. Construction of apartments is continuing at a lesser pace in Chicago, Washington and San Francisco which are areas that are already highly "apartmentalized." None of the New England cities appear on the list. The conclusions that can be drawn from these statistics are, first, that multi-family dwellings are still being built in substantial numbers in the traditional apartment cities; second, rapid growth of a metropolitan area seems to provide a climate for apartment building, even in smaller cities, whereas relatively slow growth seems to inhibit this sort of construction, even in cities where there is a tradition of apartments. These factors apparently set the stage for viewing the apartment market.
The Market for Apartments
The rules governing the housing market are basically the same as those governing the exchange of any scarce commodity. In theory, price and volume are determined by the equilibrium point of supply and demand. Real estate, however, has several characteristics that make its market distinctive and complex. One unusual feature is the great variation in quality of real estate. In addition to structure differences, no one site can duplicate another in location. Another feature is the large investment that real estate entails and its relatively long physical and economic life.
There are many submarkets in the over-all housing market due to qualitative differences. Most readily apparent is the distinction between single-family housing and multi-family housing. While lines may also be drawn between home ownership and rental housing, this approach does not embody any judgment about the quality of the dwelling units because free-standing single-family homes can also be leased. The cross-relationships between housing submarkets have been examined in Housing Market Analysis, A Study of Theory and Methods, a monograph by Rapkin, Winnick and Blank, published by the Housing and Home Finance Agency. This book is highly recommended as background for local housing studies.
The authors point out the conceptual difficulties in drawing some of the finer distinctions between housing submarkets. For example, there may be a great deal of disagreement in determining the quality of housing by its physical characteristics. Some critics regard Park Avenue apartments as inferior "slum" housing, whereas, according to rental criteria, they are classified as high-quality units. Similarly, although the number of dwelling units per structure has been emphasized in the introduction to this report, it is a crude approach because it says little about the quality of the units within the building. For example, tenements that have been subdivided through conversions may appear to have as many dwelling units as a high-rise apartment. For purposes of analysis, even the distinction between tall buildings and low buildings may lack significance because there may be a closer relationship between garden apartments and single-family homes than between different types of multi-family dwellings whether they are high-rise or low-rise. There are, of course, other subcategories in the housing market, based on such distinctions as age of structure, size of dwelling unit, location in the metropolitan area, and the relationship to transportation, shopping and community facilities.
Another characteristic of the real estate market is the slow rate at which changes in inventory are made. During the standing stock period, the time within which the existing inventory is unchanged by creation of new units or removal of old units, the supply is the inventory itself and theoretically is available for occupancy at any rent that at least covers operating costs. As a result of market pressures, the inventory cannot be increased until after a construction period has elapsed. If demand exceeds supply, the immediate effect is to create an upward pressure in rents during the standing stock period. This, in turn, induces builders to expand the supply of apartments during the construction period that follows. There are, however, many additional complexities in the housing market. Rents may be slow to change due to the fixed terms of a lease. In areas where rent control is in effect, the result is to encourage occupancy (demand) while inhibiting an increase in supply.
Legislated financing arrangements may have the effect of creating a demand for one type of housing and suppressing it for another. For example, since World War II, the Federal Housing Administration and the Veterans' Administration have been authorized to extend more favorable mortgage terms for single-family detached housing than for multi-family housing.
Housing Market Analysis
Housing market analysis is becoming increasingly sophisticated in theory and technique. It would be difficult to present a compendium of the many methods of making housing market studies. The Housing and Home Finance Agency in Know Your Housing Market has outlined the following basic components of a housing market analysis. The information, based on analyses undertaken in Front Royal (Virginia), Memphis (Tennessee) and Mobile (Alabama), is summarized to serve as a check list for studies elsewhere. Since no two markets are exactly alike, emphasis will vary but all of the factors listed should be considered and evaluated in a housing analysis.
1. Analysis of the economic base of the area.
a. Past trends
b. Present distribution of economic activities
c. Major employers
d. Economic outlook of the area
2. Basic factors in housing demand.
a. Population and household trends
b. Characteristics of the population
c. Locational shifts of the population
d. Family income distribution and trends
e. Tenancy Preferences
3. The housing supply.
a. General characteristics
b. Condition and needs
c. Value and rent distribution
d. Changes in the supply through new construction, conversions and demolitions
e. Special governmental programs (publicly owned housing, urban renewal, rent control, etc.)
4. The current housing market situation.
a. Vacancies
b. Real estate transfers
c. Construction costs
d. Rent and sales price trends
e. Capacity of the local building industry
f. Building sites and raw land
g. Taxes and community controls
5. Effective housing market demand and consumer preferences.
a. Volume
b. Size of units; size of lots
c. Geographic location
d. Rental-sales preferences
e. Sales price and rental distribution
f. Financing terms desired
g. Type and architectural style preferences
h. Special features wanted by buyers (type of heating, number of baths, carports, fire places, etc.)
The Demand for Apartments
The demand for apartments is determined by the rent level at which they are available, income levels, tastes, family formation and composition, and the prices of alternative types of housing. Louis Winnick, in Rental Housing, lists several groups for which rental housing, apartments included, may be more suitable than desirable.
Newly married couples can usually satisfy their space needs with smaller dwelling units that are characteristic of rental housing. Working couples may desire a location near their places of employment.
Single individuals, unwilling to devote much time to household chores, similarly have very low space requirements. They also may wish to be centrally located.
Highly mobile persons, either as a result of temperament or habit, or because of job demands, do not wish to make any long-term commitments in their living arrangements and will probably be drawn to rental housing.
Minority groups may be forced into rented quarters due to discrimination and low income. In many cases, this conditional demand arises due to instability of income and because of a loosely organized family structure.
The elderly are often in possession of homes free of debt even though their incomes and space needs are below average. While this arrangement is suitable for some senior citizens who cherish neighborhood ties and use the surplus living space for family visits, others are unable for physical and financial reasons to maintain their single-family homes. There is a need for dwelling units that are especially suited to these persons who are coming to form an ever larger percentage of the population.
The financially insecure are probably better suited to the short-term financial commitment of rental housing that can be revised periodically in relation to the family fortunes rather than the long-term commitment of mortgage payments.
The house haters are those who have a natural aversion to home ownership and all that it implies. They have no desire for the responsibilities of home ownership, nor do they want the private outdoor space associated with single-family houses. This urbane group, which forms the core of the market for luxury apartments, is nevertheless often forced to accept housing not to its liking because of an insufficient supply of attractive apartments.
Vacancies
One of the more significant success indicators of an apartment venture is the vacancy rate during the standing stock period, since it will indicate a course of action for the construction period. There is a danger, however, in using this indicator without some degree of interpretation. Temporary economic fluctuations will have an effect on apartment occupancy. In a city like Seattle, vacancies are related to activity in the aircraft plants. In some of the fast-growing West Coast cities, accelerated construction of multi-family residences has for the present time produced a discrepancy between supply and demand that shows up as a high vacancy rate. In other cities such as Buffalo, Chicago, Detroit, Los Angeles, Philadelphia and San Francisco, the greatest demand is for luxury apartments with service and extras. House and Home (October 1960) notes that in Detroit there is almost 100 per cent occupancy in semi-luxury high-rise units, and up to 90 per cent vacancy in changing neighborhoods. New York has recently had a low vacancy rate and seems able to absorb a vast amount of new apartment construction. An unsatisfied demand is said to exist in Boston where construction is inhibited by high real estate taxes that can run as much as 45 per cent of the gross income.
According to the House and Home article, the vacancy rate in many cities can be explained as follows:
- In most cities, the vacant apartments are poorly located and lack distinction.
- In many cities, the vacant apartments are mostly in the lower rent category.
- In many cities, high vacancy rates are the result of special local conditions.
- A high apartment-construction rate can create a high (and misleading) vacancy rate.
- And since 30 per cent of all apartments are not fit to live in, it would be a good thing if they were vacant.
Planning and the Market
In evaluating a multi-family housing project, a community should be concerned about the quantity, location and quality of the proposed development. The quality of structures and extent of land area that is anticipated will go into multi-family development should be controlled to roughly coincide with the market for this type of housing. The community should insure that apartments are built to meet the best standards that have been evolved for such housing. It should be remembered that rental tenants do not necessarily have any long-range stake in their housing and as soon as they are dissatisfied or can afford quarters that are more attractive, they will leave.
Both the quantitative and qualitative objectives can be partially achieved through zoning. With this tool, land with an appropriate residential capacity, properly located, can be set aside for a multi-family development. Zoning regulations, along with building and housing codes, can go a long way toward assuring that the housing will be a lasting community asset.
Zoning For Multiple-Family Dwellings
To a large extent, zoning regulations are still shaped by the existing physical development even though the standards may leave something to be desired. For example, the legacy of extremely intensive development in areas of Manhattan Island, permitted under the 1916 New York City ordinance, is still allowed under the 1960 revision.
It should also be remembered that earlier zoning ordinances lacked the sophisticated refinements which have been embodied in more recently drafted regulations. Haar indicates that:
The existing technique of controlling intensity of use by means of height limitation and yard and setback requirements is largely a geometric control, or, as many consultants complain, a "zoning envelope" which dictates the shape of the building by prescribing its outer measurements. Modern zoning ordinances are trying to break through this rigid dictation of size in order to permit the greatest possible flexibility in protecting neighborhood character and in satisfying individual needs and architectural design.
The ziggurats of New York bear witness to the envelope that was permitted under the original ordinance. Nevertheless, the influence of earlier codes is apparent in the comprehensive revision. Chicago buildings, under the influence of setback regulations, have a more monolithic form.
Zoning for apartment houses will be approached by examining the objectives that might be considered if this type of development is allowed. The second step will be to review the methods of accomplishing these objectives. It is not the intention of this report, however, to discuss "planned development provisions" (see ASPO's Planning Advisory Service Information Report No. 27) that will undoubtedly be often used as a vehicle for multiple-family projects. Nevertheless, the criteria mentioned here may be applied by the public body that reviews a "planned development" application.
Objectives
Zoning for health, safety and the general welfare finds its legal basis in the police power. Concerned as it is with land use, it parallels planning activity and is one of the tools for implementation of the plan. The type of land use and the intensity of use may be regulated through zoning. Permission to use land in a particular manner, combined with market pressures for utilization, enables the planner to predict with a fair degree of accuracy the requirements of an area when it is built up and the impact it will have on adjacent areas, the city and the region. Inaccuracies may arise since there is never a compulsion to build to the zoning limits, but predictions can be corrected if there is a fair knowledge of market expectations.
In addition to its function as a planning device, zoning provides protection for the owners of property and, to some extent, the assurance of well-being for the users of property. These goals are of particular concern in residential districts, especially in the case of multiple-family residences where the owners and occupants are, as a rule, not one and the same.
Economic Effects. A popular impression exists that multi-family structures have a detrimental effect on the value of single-family residences. Such commentary is often heard in public hearings. The fears of single-family residents are probably justified when the image of uncontrolled, speculative apartment buildings of the past comes to mind. But there have been no factual studies that indicate this is an inevitable result of locating well-designed and properly controlled apartments in the same area as single-family dwellings.
There is no consistent evidence that multiple-family structures draw more from municipalities in expenditures than they add in tax revenues, as compared with other housing types. A 1954 study in Greenwich, Connecticut indicated that apartments contributed 5.70 per cent of the tax income, but drew 7.62 per cent of the expenditures. Single-family residences contributed 66.66 per cent of the revenues and drew 56.60 per cent of the expenditures. In West Hartford, Connecticut, a 1960 study revealed that the opposite was true. There, apartments contributed 2.83 per cent of the tax revenues and drew 2.09 per cent of the expenditures. Single-family dwellings, by contrast, yielded 68.09 per cent of the town's revenues, but 75.38 per cent of the town's expenditures were attributed to these dwellings.
A comparison of the costs of residential land and other land uses is difficult to make because school expenditures are properly a residential cost to the municipality. A large portion of the expenditures of local government are used to provide and operate educational facilities. As the number of residences increases, school expenditures are likely to increase also. Nevertheless, an educated populace is an asset to the users of commercial and industrial land.
In general, multi-family residences have fewer children of school age per dwelling unit than do single-family residences. In a 1959 study by the Maryland National Capital Park and Planning Commission, it was found that Montgomery County luxury and restrictive (regulations restricting occupancy by children) apartment projects yielded an average of .02 students per dwelling unit, standard or average projects .15 students, and family developments .33 students. The figures for Prince George's County were .08, .15 and .19 students, respectively. As is generally true, apartments house fewer school children per dwelling unit than does the average single-family development.
Aesthetics. Beauty is said to be one of the basic values of both aboriginal and civilized societies. The importance of this "eternal" in the field of housing may be questioned, insofar as discrimination may be more highly refined in our society when it comes to women or automobiles. Furthermore, in all three of these areas, popular taste changes from time to time. Nevertheless, anyone who has dealt with neighborhood groups is fully aware of the concern for aesthetics and the criticism that greets a proposal to build a structure that deviates from the norm. This may be true for two reasons. First, there may be a genuine appreciation for what is currently considered beautiful and a distaste for the ugly. Indeed, the public can often be credited with a better aesthetic sense than is generally held. Second, there may be a widespread fear that apartment buildings with an unpleasing appearance will adversely affect property values.
The doctrine has evolved that the police power may not be used to attain objectives that are primarily aesthetic. Therefore, public aesthetic controls are approached circuitously. Under present regulations, the general shape of a building and its placement on the site are prescribed, but virtual uniformity of building size and orientation along a street can be assured. The location of accessory buildings can be regulated. The "residential character" of a neighborhood can be maintained. Domineering buildings, especially with regard to height, can be prohibited.
Zoning cannot regulate design elements or details of a structure, nor can it assure the optimum orientation either from the viewpoint of the occupants or their neighbors. "Aesthetic zoning" can perpetuate an existing motif. The question is whether the present scope of zoning can allay fears that are based on a stereotype image of the apartment house.
Amenities. By contrast, the provision of certain amenities in housing finds a firm place in the police power. Measures designed to assure adequate light and air found early acceptance by the courts. The early method was to prescribe the distance between buildings and to limit the height, a crude method which has the further effect of dictating the building envelope and its placement on the lot.
More advanced zoning ordinances now require useable open space in conjunction with residences. The scientific basis of these requirements is still unclear, but it accords intuitive recognition to the place of the open space in man's life. Open space, thought of from this viewpoint, does not include area devoted to service driveways or off-street parking and loading. Its purpose is to provide space for greenery, drying yards and recreation. These objectives are usually not explicit so that often the open space requirement coincides with other provisions in the ordinance, such as those for yards. Since it is only open space that is required, and not space for recreation or a landscaped area, the results of these regulations are uncertain and the space itself may be no more useable than customary front, side or rear yards. Nevertheless, there is legal support for useable open space which finds its basis in providing for such amenities as recreation, comfort and pleasure.1
Privacy is an objective which has been approached in a roundabout manner. In multiple-dwelling districts, it is largely a function of density although the details of design seem to be equally important. In low-density areas, privacy is achieved by appropriate placement on the lot, which sufficiently removes a house from its neighbor. Yard requirements are instrumental in the attainment of this goal. Thin walls in an apartment do not necessarily provide privacy within the building. But spatial removal of the building from other structures may decrease the annoyance which emanates from a structure which is heavily occupied.
Court requirements are an attempt to insure that all habitable rooms within a building have at least minimum light and air, and that windows are somewhat removed from others in the same building. Thus, not only does zoning have the purpose of protecting a property owner from the abuses that might be perpetrated by his neighbor, but steps are taken to protect future tenants of a building.
Nuisances. A major objective of zoning is protection against nuisances. Most important are the provisions that regulate the use of land, for in this way it is hoped that incompatible land uses will be segregated from one another. However, under the present cumulative system of regulating uses from most restrictive to least restrictive, there is no guarantee that single-family residences in less restrictive zones will be afforded adequate protection. This difficulty may be corrected with the development of exclusive zoning or performance standards.
Zoning is also oriented toward the minimization of nuisances other than those that are characteristic of the land use itself. Noise, for example, is dissipated with distance and hence yard requirements may reduce disturbances from the street and neighbors. The result, presumably, is reciprocal. There is a danger that some zoning requirements may be directed against what might only be a popular conception of a nuisance: undesirables. There is certainly no excuse for masking segregatory practices in the zoning ordinance, although this may be the result when arbitrary regulations run contrary to the market mechanism.
Method
In order to achieve these objectives, the provisions of most zoning ordinances approach the problem from four directions: land use, density of population, density or bulk of structure, and access to light and air.
Land Use. Multiple-family residences are usually allowed in the least restrictive of the residential zones. There are no instances, of which we are aware, in which a district is zoned exclusively for apartments. The reason is quickly apparent when it is realized that apartment structures are often the successor to single-family residences that have remained during the transition period. It is rare that one finds a built-up area of a city that is used exclusively for apartments. The statement of legislative intent pertaining to general residence districts in the New York City ordinance points out that:
These districts are designed to provide for all types of residential buildings, in order to permit a broad range of housing types, with appropriate standards for each district on density, open space, and spacing of buildings. The various districts are mapped in relation to a desirable future residential density pattern, with emphasis upon accessibility to transportation facilities and to various community facilities, and upon the character of existing development. These districts also include community facilities and open uses which serve the residents of these districts or are benefited by an open residential environment.
Most ordinances list explicitly those uses which are permitted as a right and those that are permitted as a special exception. In general, all types of housing are allowed. What other uses are allowed will depend on local circumstances. In Appendix A there is a list of nonresidential uses that are permitted in general residence districts of several major cities. Appendix A is a check list and not a recommendation. The list should be tailored to the local situation and conditions should be applied to prevent abuses. The local governing body should further decide whether these uses are to be allowed as a right or through special permit. Accessory uses should be described either in the "definition" section of the ordinance or in the district regulations if they are to vary from one zone to another.
Density of Population. The population density of an area should be controlled in order to prevent overcrowding and congestion, to assure that there is sufficient open space for the expected population, and to provide for orderly planning and development of street and transit facilities, utilities, schools, parks and other necessary facilities. There is, of course, no fixed density that is optimum under all conditions for there are two important variables. The first is the standard of housing that is considered satisfactory at any one time and subsequently embodied in the zoning provisions. The other factor is the ability of the community to supply the facilities that are needed to support any given population density.
The Committee on the Hygiene of Housing of the American Public Health Association in 1948 undertook to set up optimum standards for housing. Their findings were published in Planning the Neighborhood. For multi-family dwellings, the suggested total land area per dwelling unit is derived from components that are consumers of land: 1) area covered by buildings, 2) outdoor living, 3) area for service, drying, walks, and yards, 4) off-street parking. The sum constitutes net residential land area that can be used to calculate optimum density as a basis for zoning requirements.
The spatial requirements evolved in the study are based on an assumed gross floor area of 870 square feet per dwelling for buildings up to six stories and 945 square feet per unit for taller buildings. Outdoor living space is based on an assumed requirement of 400 square feet per family for low buildings, decreasing to 200 feet for high-rise structures with the additional requirement of a play lot. The open areas must be accessible for daily use; purely ornamental, fenced-off areas are excluded. Off-street parking is calculated on the basis of two-thirds automobiles per family except for l3-story buildings where one-half car is assumed. The results of these assumptions are summarized in the following table.
Table 6.
Lot Area - Recommended Allowance Per Family By Apartment Type And By Component Use
| Land Area: Square Feet Per Family | |||||
| Dwelling Type | Total | Covered by Buildings | Outdoor Living | Service, Walks and Setback | Off-Street Parking |
| Multi-Family (Common Access & Services) | |||||
| 2-story | 1,465 | 435 | 415 | 455 | 160 |
| 3-story | 985 | 290 | 315 | 220 | 160 |
| 6-story | 570 | 145 | 215 | 50 | 160 |
| 9-story | 515 | 105 | 215 | 35 | 160 |
| 13-story | 450 | 75 | 215 | 35 | 125 |
Source: Planning the Neighborhood. American Public Health Association, Committee on the Hygiene of Housing. 1960
Table 7.
Lot Area Per Room Or Dwelling Unit (Square Feet)
| New York (1960) |
(Minimum per "living" room) |
R10 | R9 | R8 | R7 | R6 | R5 | R4 | R3 |
| 30 | 39 | 44 | 72 | 96 | 173 | 275 | 375 | ||
| Chicago (1957) |
R8 | R7 | R6 | R5 | R4 | R3 | |
| D.U. | 115 | 145 | 200 | 400 | 900 | 2500 | |
| Efficiency | 75 | 95 | 135 | 265 | 600 | ||
| Lodging room | 60 | 75 | 100 | 200 | 450 |
| Boston (proposed 1958) |
H4 | H3 | H2 | H1 | R.8 | R.5 |
| None | None | None | 1000 | 1500 | 3000 |
| Detroit (1942) |
(Minimum per room of more than 80 sq. ft.) | RMU | RM4 | RM |
| 200 | 300 | 400 |
| Minneapolis (Proposed 1959) |
R6 | R5 | R4 | |
| 400 | 900 | 1500 |
| Los Angeles (Amended to 1955) |
DUs with | R5 | R4 | R3 |
| More than 3 rooms | 400 | 800 | 1200 | |
| 3 rooms | 300 | 600 | 1000 | |
| Less than 3 rooms | 200 | 400 | 800 |
| Cincinnati (Proposed 1958) |
R7 | R6 | R5 | R4 | |
| Bedroom unit | 800 | 1000 | 1200 | 1500 | |
| Efficiency | 500 | 600 | 700 | 800 |
| San Francisco (1960) |
R5 | R4 | R3 | |
| 125 | 200 | 400 |
Source: Zoning Ordinances of Cities listed.
This table gives an indication of desirable standards for lot area per dwelling unit and can be compared with the provisions of the selected ordinances listed in Table 7. The shortcoming of controlling dwelling density is that it measures the population load on land only indirectly. The number of persons per dwelling unit varies with income, the size of the unit (number of rooms), and the type of tenant that is attracted into the apartment market.
Consequently, refinements are now appearing in many zoning ordinances which gear the lot area requirement to the size of the dwelling unit. In the newly adopted New York City ordinance, lot area in the general residence districts is tied to rooms rather than dwelling units. In Chicago, the lot area requirements for efficiency units is only about two-thirds of that required for "ordinary" units and for lodging rooms it is reduced to about a half of the full spatial requirement.
Some ordinances vary the lot area per dwelling unit requirement according to the size of the dwelling unit. The Seattle (amended to 1960) provisions are an example:
| Zone | When the number of bedrooms per dwelling unit is: | Minimum lot area per dwelling unit: |
| RMH | None | 200 sq. ft. |
| One | 400 sq. ft. | |
| Two or more | 600 sq. ft. | |
| RM | None | 800 sq. ft. |
| One | 1000 sq. ft. | |
| Two | 1400 sq. ft. | |
| Three or more | 1800 sq. ft. |
The Pittsburgh zoning ordinance (1960) goes even further and specifies the lot area requirements for each type of dwelling unit in addition to varying the requirement for different size units in multi-family dwellings. The R 5 Multiple-Family Residence district is an example:
| Lot area per dwelling unit or suite | |
| A — Multiple-family dwelling or apartment hotel over three stories — for each dwelling unit or suite with | |
| Four or more bedrooms | 825 square feet. |
| Three bedrooms | 600 square feet. |
| Two bedrooms | 500 square feet. |
| One bedroom | 450 square feet. |
| B — Multiple-family dwelling or apartment hotel of three stories for each dwelling unit or suite with | |
| Four or more bedrooms | 1840 square feet. |
| Three bedrooms | 1310 square feet. |
| Two bedrooms | 1100 square feet. |
| One bedroom | 1000 square feet. |
| C — Multiple-family dwelling or apartment hotel less than three stories, other than a row, for each dwelling unit or suite with | |
| Four or more bedrooms | 3000 square feet. |
| Three bedrooms | 2100 square feet. |
| Two bedrooms | 1800 square feet. |
| One bedroom | 1600 square feet. |
| D — Row dwelling | 2500 square feet. |
| E — Two-family dwelling | 3000 square feet. |
| F — One-family dwelling | 5000 square feet. |
In general residence districts there is likely to be a mixture of housing types, hence many ordinances specify the lot area requirement for each dwelling type which, in turn, may vary from one zone to another. An alternative approach is to establish a fixed minimum lot size with additional lot area requirement for each additional dwelling unit.
Finally, there are indirect methods of controlling population density that are based on control of structure bulk. When building bulk is limited and dwelling unit size is established, either through the market or regulation, population density can be effectively controlled also.
Bulk of Structure. Several types of regulations can be grouped under the heading "bulk controls." The line between bulk controls and those that regulate density of population and light and air is vague, since there is a loose relationship between the size of a building and the degree of activity or the number of inhabitants that can occupy a structure. But, density provisions have little effect on the physical structure itself. Light and air controls, on the other hand, are directed toward the relationship between buildings. Seemingly, bulk controls have as their objective an intangible sort of amenity that is not provided for in other ways. They also supplement other types of regulations in which we have placed reliance. For example, height, yard, and setback requirements function crudely when they are used to regulate both bulk and light and air. Flexibility in design is permitted and even encouraged if supplementary controls are introduced to provide an option among the physical limits on building size.
Floor area ratio (FAR) is a popular form of bulk control and has been incorporated in a great many of the newer zoning ordinances. The concept is simple: the maximum permissible floor area of a building is a fixed ratio of the lot area. The evolution, the application and the implications of this concept were explored in detail in ASPO's Planning Advisory Service Information Report No. 111 (Floor Area Ratio).
There is a great deal of variation in FAR regionally, among cities in the same region and between cities and towns in the same metropolitan area. The following table indicates the range of floor area ratios in some of the major cities of the United States.
Allowing a very generous one thousand square feet of gross floor area per dwelling unit, about 23 units can be built on an acre when the allowable FAR is 0.5, 43 with a FAR of 1.0, 87 with a FAR of 200, 217 with a FAR of 500, and 435 dwelling units per acre when the maximum floor area ratio is 1000 which under certain circumstances approaches the allowable limit in the most intensive residential zone in New York and Chicago. These figures are presented to give an indication of what a given FAR means when it is incorporated in a zoning ordinance. In terms of dwelling units, the calculation is conservative because the floor area of most apartments now being built is far short of one thousand square feet. On the other hand, when off-street parking is required and is included in calculating the floor area of the building, the floor area per dwelling unit is increased and density decreased.
The control of floor area by itself suggests nothing about the shape of a building. Indeed, where a FAR of 2.0 is allowed, there may be no virtue in covering the entire lot with a two-story building when a better solution might be to build a six-story building on one-third of the lot. Floor area controls must be used sensibly in conjunction with other dimensional controls such as yard requirements, height and coverage limits if the community wishes to avoid architectural freaks. Using the same example of a FAR of 2.0, it would make little sense to impose a height limit of two or even three stories, since this would dictate a low building with high lot coverage, thereby nullifying the very options for which FAR controls were developed.
Table 8:
Basic Floor Area Ratios for Apartment Districts
| New York (1960) |
||||||||
| R10 | R9 | R8 | R7 | R6 | R5 | R4 | R3 | |
| 12.0 | 7.52** | 6.02** | 3.44** | 2.43** | 1.27** | 0.75 | 0.5 | |
| Chicago (1957) |
R8 | R7 | R6 | R5 | R4 | R3 | ||
| 10.0* | 7.0* | 4.4* | 2.2* | 1.2* | 0.7* | |||
| Philadelphia (1957) |
R16 | R15 | R14 | R13 | R12 | R11 | ||
| 5.0* | 3.5* | 1.5* | 1.5 | 0.7 | 0.3 | |||
| Cleveland (Amended to 1956) |
E | D | C | B | ||||
| 1.5 | 1.0 | 0.5 | 0.5 | |||||
| Cincinnati (Proposed 1958) |
R7 | R6 | R5 | R4 | ||||
| 1.0 | 0.8 | 0.67 | 0.5 | |||||
| Boston (Proposed 1958) |
H4 | H3 | H2 | H1 | R.8 | R.5 | ||
| 4.0* | 3.0* | 2.0* | 1.0* | 0.8 | 0.5 | |||
| Washington, D.C. (1958) |
R5D | R5C | R5B | R5A | R4 | |||
| 5.0 | 2.5 | 1.8 | 0.9 | 0.9 | ||||
| Minneapolis (Proposed 1959) |
R6 | R5 | R4 | R3 | ||||
| 2.2 | 1.2 | 1.0 | 0.7 | |||||
| Denver (1957) |
R4 | R3 | R2 | |||||
| 4.0 | 3.0 | Not Applicable | ||||||
| San Francisco (1960) |
R5 | R4 | R3 | |||||
| 10.0 | 4.8 | Not Applicable | ||||||
* Indicates FAR may be increased under special condition
** Variable depending on other factors
Source: Zoning Ordinances of Cities listed.
Many communities have incorporated coverage limits to guarantee the provision of open space in conjunction with each building. When coverage provisions are used along with FAR limits, the result is to approach a prescribed form for the structure. When coverage limits are coupled with height restrictions (in stories), floor area is effectively controlled and further limits are placed on form. Coverage limits are redundant in the case of small lots where extensive yard requirements are in force. But, where there are no required yards, coverage limits are one method of insuring open space and probably in more useful parcels than would be the case with yards.
The Committee on the Hygiene of Housing has developed standards for building coverage in residential areas which are geared to building height and their derived standards for open space needs. The figures are given in the following table.
Table 9:
Coverage - Recommended By Apartment Type
| Dwelling Type | Net Building Coverage (Per Cent of Net Residential Land Built Over) Standard: Maximum |
| Multi-Family | |
| 2-story | 30 |
| 3-story | 30 |
| 6-story | 25 |
| 9-story | 20 |
| l3-story | 17 |
Source: Planning the Neighborhood. American Public Health Association, Committee on the Hygiene of Housing. 1960
In commenting on their standards for building coverage, the Committee states in Planning the Neighborhood:
... such figures are a means of achieving an end, rather than the end itself. Poorly located buildings covering only 25 per cent of the net residential land may easily admit less light to living and sleeping rooms than well designed ones with 35 per cent coverage. Coverage and height are closely interrelated, and can only be established in the process of design. At the present time, 20 per cent to 30 per cent coverage of land within property lines appears to be practical and to permit conformity with standards for light, air and open spaces. Controls which set maximum net coverages exceeding 35 per cent may fail to provide sufficient open space and may lead to overcrowding of people on the land.
Height controls are intimately related to other types of bulk controls and, along with FAR and coverage limits, there is a tendency to control the general shape of the building. Whether this is an improvement over the older types of regulations that were concerned primarily with light and air remains to be seen. The revised New York City zoning resolution incorporates a rather complicated formula which describes the interrelationship between floor area ratio, height, and open space requirements.2
New York City encourages height to a point and then "penalizes" tall buildings. Open space is gained on the assumption that the developer wishes to pack the greatest floor area into a building. There are, of course, a great many other options open to him that may be more appropriate in his judgment under special circumstances. To our knowledge, the New York ordinance is the most advanced in this type of encouragement, but there is no reason that other communities cannot fashion a set of regulations to encourage the type of building desired.
In cities where large apartment buildings are traditional, there is less concern with height limitations. The regulatory emphasis is rather on bulk (floor area) and open space. This is with the realization, perhaps, that under the circumstances it is not height per se that is objectionable; other elements of the structure are more critical. Where tall buildings are not common, an objective may be to avoid the dominance of tall buildings in a residential area. Here, there is more reason for imposing absolute height limits. As will be seen in the selected zoning ordinances from the Chicago metropolitan area, most suburban areas limit apartments to low buildings.
The Planning Board of Clifton, New Jersey issued a report which discussed the pros and cons of zoning for high-rise apartments. The recommendations of the Board did not include height limits, but a minimum height of four stories instead. In advocating high-rise apartments, bulk controls were approached only indirectly through the requirement of a four-acre lot with certain minimum dimensions to discourage the use of oddly shaped parcels. Coverage was limited to 15 per cent. The most important controls suggested were the limitations on population density at 50 dwelling units to the acre, and a setback distance from the lot lines of one-half the height of the building. The report seems to imply that standards can be developed to permit high-rise apartments in suburban areas without having a detrimental effect on neighboring land uses.
Light and Air. Access to natural light is usually recognized as that portion of the sky visible from the dwelling unit. The matter is complicated somewhat when standards are set up for it must be decided what portion of visible sky is sufficient. Additional considerations include the angles at which the light enters the room and the effects of reflections from nearby surfaces.
If direct sunlight is considered, the problem changes for, here, shadows are of prime importance. Standards must be set up for the length of time that the windows of a dwelling unit should be in the sun, and for what is considered to be an effective angle of incidence within a room.
In addition to the external influences of other buildings, access to sunlight depends upon building layout and orientation, two factors over which zoning has little control. There is evidence that at this time there is little official concern for access of each dwelling unit to sunlight, for there are many recent examples of apartments with a northern exposure that receive the direct rays of the sun from a low angle for only a few weeks of a year.
The standards for access to air are not as easily determined as in the case of light. Where natural ventilation is assumed, the effectiveness of accessibility is determined by the relationship of nearby buildings, the design of the structure in question and, perhaps most important, local climate and microclimate.
Where air conditioners are in use, customary access-to-air regulations are superfluous. Apartment buildings are being constructed in which windows do not admit air from the outside and are included only to admit light and provide a view. Many zoning ordinances, however, are still grounded on the supposition that access to air, as well as light, is important.
Almost all known methods attack the problem of light and air by requiring distance between buildings, and between wall surfaces of the same building. When building height is a major factor, variations of the principle of putting distance between buildings have been embodied in zoning regulations.
Regulations based on light and air access have been used to accomplish a number of other objectives. Front yards are often required in multi-family districts. Usually the building line is described as being set back from the street a given distance in feet. Such requirements may also be stated as a percentage of lot depth, usually with an absolute minimum, especially where there are shallow lots. The front yard may also be required to conform to the building line of existing development.
On streets of normal width, there is probably little relationship between front yard provisions of many zoning ordinances and accessibility to air. But there does seem to be a connection between front yard requirements and light accessibility, if the depth of the front yard is related to building height. For example, a front yard requirement for low buildings might be unnecessary for purposes of light, but for tall structures setback requirements would be desirable. Unfortunately, front yard requirements in many communities are relaxed in multiple-family districts where taller buildings are likely to exist. Reasons other than accessibility to light and air may justify front yard requirements. Aesthetic objectives and space for future street widening might justify such requirements, but the courts have held that these reasons alone may invalidate the provisions. Privacy and diminution of street noise might also be considered, but these are conditions that are controllable through methods of design and construction.
In the case of side and rear yards, space between apartment buildings is more critical because, in the absence of these requirements, each block could be built up as a solid building mass. In addition to light and air, factors to consider are fire precautionary measures, access to the rear of structures, and passage between buildings. As in the case of front yards, there may be other reasons for requiring distance between buildings. Aesthetic objectives and some of the less tangible amenities of living, such as privacy, may be desired.
Side yard requirements for apartment buildings are usually expressed as absolute distances, often with several options available. For example, a minimum distance may be required for all side yards, but the total requirement for all side yards may exceed twice the minimum requirement. Alternatively, side yard requirements may be a percentage of lot width. This device has been used for narrow lots where absolute requirements would not leave a wide enough buildable area. In any case, a small absolute minimum is usually required. Another exception is usually made for corner lots where the side yard is, in effect, the front yard on another street. Here, the criteria for front yards are relevant, but application of these requirements might unduly restrict the use of corner property. Therefore, the requirements are often a compromise of the regulations for front and side yards.
Some residential units can be designed so that side yards are unnecessary. Row houses are an obvious example, but other types of multi-family dwellings can be built, abutting one another without detracting from amenities that justify the usual side yard requirements. For this reason, some ordinances do not require side yards in apartment districts but, if they are provided
on a voluntary basis, a minimum may be required. Implicit in such a provision is the assumption that buildings will be constructed so that windows are not needed on the sides of the structure. Builders on adjacent property have the option of designing a similar type of structure, or setting the building back the required distance from the side property line. This distance should be great enough to serve as a side yard, even though it is observed by only one property owner. For this reason, the distance is specified in the zoning ordinance.
Rear yard requirements are usually specified as an absolute distance or as a percentage of lot depth with an absolute minimum. In apartment districts that allow tall buildings, rear yards are sometimes based on building height. However, light and air requirements should become the overriding consideration in regulating the rear yard of tall buildings for there is no street to separate buildings.
Recent trends indicate a tendency to relate yard requirements to building dimensions in terms of both height and width of facade along the street and the side of the building. The Clifton Report, in considering zoning for high-rise apartments, simply recommended that the structures be set back from the lot lines a distance equal to half the height of the building.
Court regulations appear in some ordinances for the purpose of assuring adequate light and air for the structure on a particular zoning lot. In a city like New York, the abuses from extensive use of the "air shaft" resulted in windows in adjoining buildings sometimes facing one another from a distance of three feet.
The regulations now in force deal with both inner and outer courts. The New York resolution establishes a minimum area for courts. Most court regulations establish a minimum dimension which may be increased according to the height of the surrounding walls or the depth of the court. It is interesting to observe that courts generally qualify as open space and, therefore, buildings that appear exceedingly bulky from street observation actually have a lower lot coverage than expected. The open space itself, however, is generally useful only as an access to interior entrances.
Setback, for the purposes of this report, refers to the requirement that the upper stories of a structure be removed a greater distance from the lot line than the distance required for the first story (according to yard regulations). The purpose of staggered setbacks is to increase the amount of light that penetrates toward ground level in an area of high buildings. Setback requirements are usually described by a "sky angle plane" which may originate from a point within the street (as in the old New York City zoning ordinance).
It can also be defined as an angle originating from the height limit of the front wall on the building line (as in the New York ordinance). Or it may originate at a specified angle from the lot lines (as in the Denver ordinance). There are exceptions which are permitted to break through the sky angle plans. The most dramatic of these is the allowance of towers that may cover 25 per cent of the lot area as permitted under the New York regulations.
Setback requirements are a compromise insofar as the setback angle is rarely related to the actual angle of the insolation. Some cities, notably Chicago, do not have these provisions. Critics of staggered setbacks contend that buildings which have not been designed under such regulations have a "cleaner" appearance.
Specifications for spacing of buildings on the same lot have appeared in zoning ordinances recently. Their objective is to apply the same standards to large-scale projects with two or more buildings on one lot as required if each building were on a single lot. Problems arise in drafting such regulations because architectural contrivances may be used to escape these provisions. The "single lot" provisions may bear less heavily than spacing requirements. For example, two tall buildings, connected on the lower floors, might be regarded as a single structure bound by court requirements (or none at all) rather than the building spacing requirements. The requirements for building spacing in the New York City resolution are as follows:
. . . the minimum distance between any two buildings (referred to as building A and building B) shall vary according to the length and height of such buildings. Such minimum distance shall be either 30 feet or the distance required under the following formula, whichever is the greater distance:

S=required minimum horizontal distance between any wall building A, at any given level, and any wall of building B, at any given level, or the vertical prolongation of either.
LA=total length of building A.
The total length of building A is the length of that portion or portions of a wall or walls of building A from which, when viewed directly from above, lines drawn perpendicular to building A will intersect any wall of building B.LB=total length of building B.
The total length of building B is the length of that portion or portions of a wall or walls of building B from which, when viewed directly from above, lines drawn perpendicular to building B will intersect any wall of building A.HA=height of building A.
The height of building A at any given level is the height above natural grade level of any portion or portions of a wall or walls along the total length of building A.HB=height of building B.
The height of building B at any given level is the height above natural grade level of any portion or portions of a wall or walls along the total length of building B.
For the purposes of this Section, natural grade level shall be the mean level of the ground immediately adjoining the portion or portions of the wall or walls along the total length of the building.If "LA+LB" is equal to zero, the formula set forth above shall not apply, and the minimum distance shall be 30 feet. . . .
The British have adopted a system based on daylighting standards for controlling the spacing and height of residential buildings. The scheme was recommended in The Density of Residential Areas, a handbook published by the Ministry of Housing and Local Government. Indicators, illustrated below, are used to test the positioning of buildings. The B series is used as a gauge to determine the proper distance from the center line of surrounding streets and property lines. The D series is used to check the height and distance from one building to another.
Light that strikes a window at an angle of less than 45 degrees is ignored. Light arriving at an angle of less than 25 degrees in the B series is disregarded by the indicators on the assumption that structures on the other side of the property line or street center line will observe the same standards. The D series, which tests the relation of the structure to other buildings, disallows daylight incidence up to 45 degrees from the point being tested. The indicators are used by testing every point of the building at ground level. The daylighting standards are being satisfied if anyone of the indicators in the appropriate series shows that the point in question passes the test. Using the B series as an example, the wide short sector described by B 1 credits light that comes over buildings, whereas light arriving between tall buildings can be counted by the long narrow sector of B 4. The same is true of the D series. The light need not arrive through a single clear sector; an aggregation of gaps, wide enough when taken together, will satisfy the daylighting standard.
Figure 3. Permissible Height Indicators for Residential Buildings spaced for DayLighting

The English system, which is now applied under the Town and Country Planning Act of 1947, has the advantage of directly relating the standards for light to the source of light. It also applies to all types of dwelling units.
Within this framework, there is much latitude for the placement of buildings. But in this country, other objectives, such as preservation of value, aesthetics and other general amenities, have been encouraged through requirements based on light and air. Complete dependence on daylighting standards in our ordinances might fail to achieve the full purpose of our regulations. Nevertheless, the straightforward nature of the British system is refreshing.
Other Customary Provisions. Lot width is a frequent requirement in zoning ordinances. The appropriate dimension, of course, varies with the housing type. It is included in many multi-family regulations to supplement other requirements. In single-family districts, this requirement can be used to maintain a "standard" module that may have a beneficial aesthetic effect. It also prevents unusually deep, narrow lots that would otherwise comply with the area requirement. But, narrow lots are precisely the kind needed for row houses. It is difficult in a general residence zoning district to include a minimum width requirement that will be useful in all cases. This requirement is frequently dropped in apartment districts for multi-family structures or, if retained, it is reduced to the dimensions necessary for a row house.
Off-street parking provisions are now included in most residential districts, especially in high-density areas. Sometimes, parking is allowed off the site of a multi-story building within a specified distance of the structure. The appropriate ratio of parking places to dwelling units will vary from one community to another.
The propensity for car ownership among apartment dwellers is, of course, subject to the proximity of mass transportation and family income. The Clifton, New Jersey Report recommended one and a half parking spaces for each apartment in the proposed high-rise apartment district. Other parking requirements are given in the following table.
Table 10:
Off-Street Parking Requirements in Zones of Highest Density
|
|
|
| New York R10 (1960) |
|
| Group parking for new residences under single ownership | .4 |
| Public housing | .12 |
| Chicago R8 (1957) |
|
| Dwelling units | .6 |
| Efficiency units | .4 |
| Lodging rooms | .167 |
| Philadelphia R16 (1957) |
|
| Per family | 1.0 |
| Los Angeles (Amended to 1955) |
|
| DU of more than 3 rooms | 1.0 |
| DU of 3 rooms | .75 |
| DU of less than 3 rooms | .667 |
| San Francisco (1960) |
|
| Per DU | 1.0 |
| Cincinnati (Proposed 1958) |
1.0 |
| Minneapolis (Proposed 1959) |
1.0 |
| Boston (Proposed 1958) |
0.5 |
| Washington, D. C. (1958) |
.25 |
(Spaces per dwelling unit)
Source: Zoning Ordinances of Cities listed.
In high-density residential districts, there may be need for off-street loading provisions. Although we have come across few examples, these types of provisions should be carefully considered. Curb loading zones or loading bays might be utilized as an alternative.
Location of Apartments
A problem that parallels that of evolving standards for construction of apartments is the establishment of apartment districts. In planning, the rationale for locating apartments can be based on a combination of considerations. These include transportation, land value, urban structure, topography, soil conditions, municipal facilities, amenities (such as view), and a host of other subtle and less tangible factors.
In "The Plan for Residence" in the Comprehensive Plan for the City of Philadelphia, proposed densities are based on certain characteristics of the urban structure. In Figure 4, sketch A shows a series of rings of decreasing density from the center out, the dominant pattern of density. Sketch B shows the major subcenters, each of which represents an area of higher density in the general fields and each also having small rings of decreasing density. Sketch C shows the rail transit stops; each of which represents an area of transportation advantage and is therefore a location of potentially higher density than its surrounding field. In sketch D, all of these factors are superimposed. This is the basic abstract pattern of relative density from which the residential density evolved. Sketch E is the residential density plan for the city of Philadelphia.
Figure 4

Courtesy of Philadelphia City Planning Commission
The zoning standards for two sectors in the Chicago metropolitan area are summarized in Appendix B and correspond to the cities and villages outlined on the map. Within the city of Chicago, the areas in which the highest densities are allowed extend along the lake front. It is evident that this pattern stems from the desirability of being near the most powerful natural feature of the region which provides a pleasant view and also serves as the city's primary outdoor recreational area. Outside of the city, there is in general a decrease in maximum allowable density as distance from the Loop increases.
It is apparent that some of the suburban cities take their cue from the standards of the central city. Using floor area ratio as an example, Evanston with a maximum of 4.0 far exceeds the limit that exists in central Cleveland, Cincinnati or Minneapolis. The table in Appendix B should be approached with caution, for it is an illustration of zoning within a metropolitan area and not a recommendation. The quality of the zoning regulations seems to be more a function of the date when the ordinance was adopted rather than of any other factor. It is presented to show the general variation in standards that are adopted in suburban towns as distance from the central city increases.
Conclusions
Once again, serious consideration is being given to the apartment house as a partial solution to the problem of housing a nation. The construction trend indicates that we can expect a boom in multi-family residential construction that will surpass that of the twenties, although most likely it will not be as significant as a proportion of total new construction.
It has been pointed out that there is a substantial portion of the population that can suitably live in apartments. These groups include newly married couples, single and highly mobile individuals, the elderly, the financially insecure and the house hater.
Many attractive apartment projects have been built in recent years. This activity has occurred not only in older central cities where multiple-family residences were a traditional form of housing, but also in suburban areas and in the newer cities of the nation.
The methods of guiding the form of multiple-family residences through zoning has been examined in this report, and the provisions that have been cited are examples of controls that have been used. The purpose of the report is not to recommend specific provisions, but to cast light on the rationale behind various types of regulations.
In general, existing regulations for apartments have been developed in central cities of high density. Most suburban areas permit apartments under standards that are not radically different from those of the central city, but often they are considered as "second-class" dwellings in the community.
The growing popularity of apartments in the suburbs and rapidly growing cities outside of the great industrial belts of the eastern seaboard and the Midwest should call for a re-examination of existing ordinances to see if they are designed to encourage the best kinds of development. A major question is the extent to which apartments and single-family dwellings can exist compatibly in relative proximity. The solution to this problem calls for an examination of the planning, considerations, economic effects, aesthetic aspects, and the amenities provided by multi-family residences in a particular context.
New regulations can be devised to permit the type of apartment development that is most suitable for a locality, but it is most important that the community objectives first be identified. The view taken in this report is that no single form of housing is innately superior to any other.
Appendix A
Uses Which Are Often Allowed in General Residence Districts
Accessory uses
Home occupations (should be specified)
Planned developments
Signs (according to regulation)
Temporary buildings for construction purposes (with duration limited)
Apartment hotels
Boarding house, rooming house, guest house
Motel
Hotel
Shops in an apartment house or hotel, provided they are accessible to the public only through the lobby with no advertising or display visible from outside the building
Foreign consulates
Philanthropic or nonprofit institution
Schools, elementary and high, nonboarding or boarding
College or university
College or school dormitories, fraternity or sorority houses
Seminaries
Nursery school
Libraries, museums, or noncommercial art galleries
Monasteries or convents
Churches and places of worship, rectories or parish houses
Clubs or lodges (with restrictions as to activity and not for profit)
Community centers or settlement houses
Proprietary nursing home or sanitarium
Health centers
Medical centers (with restrictions)
Nonprofit or voluntary hospitals (not animal hospitals)
Proprietary hospitals
Institutions for children and the aged
Rehabilitation center for handicapped persons
Noncommercial recreational centers
Golf courses
Outdoor tennis courts and ice skating rinks
Public parks, playgrounds or private parks
Welfare centers
Cemeteries
Parking facilities (often a conditional use)
Fire station
Police station
Terminal for public transit vehicles
Utility installation (according to regulation)
Water reservoir
Storage of flammable liquids or gases for heating purposes only (subject to quantitative limit)
Railroad rights-of-way
Agricultural uses (with restrictions)
Appendix B
Zoning Provisions Applicable to Apartments in Zones in Which They Are Allowed in Selected Localities in the Chicago Metropolitan Area
| City or Village (Date of Ordinance) |
Distance from Loop (miles) | Density (persons per sq. mile, 1955) | Apartment Zone | Lot Area per D.U. | Height Limit | FAR |
| Chicago (1957) |
15,850 | R8 | 115 | 10.0 | ||
| R7 | 145 | 7.0 | ||||
| R6 | 200 | 4.4 | ||||
| R5 | 400 | 2.2 | ||||
| R4 | 900 | 1.2 | ||||
| R3 | 2500 | .7 | ||||
NORTH SHORE SECTOR |
||||||
| Evanston (Proposed 1958) |
12 | 9,878 | R7 | 400 | 84 ft. | 4.0 |
| R6 | 850 | 45 ft. | 1.5 | |||
| R5 | 2,500 | 40 ft. or 3 stories | .6 | |||
| R4 | 3,000 | 35 ft. or 2.5 stories | " | |||
| Wilmette (Proposed 1959) |
15 | 4,927 | R4 (75% of which are 3 rooms or more) | 1,000 | 35 ft. | |
| Kennilworth | 16 | 5,225 | "D" Commercial | 2,500 | 35 ft. or 2.5 stories | |
| Winnetka (1942) |
18 | 3,610 | "B" Apt. houses for not to exceed 2 families | 3,600 | 35 ft. or 2.5 stories | |
| Glencoe (1959) |
21 | 2,765 | "D" | 1,800 | 33 ft. or 2 stories | |
| "E" Business | 1,200 | 40 ft. or 3 stories | ||||
| Highland Park (1947, as amended) | 26 | 2,118 | "F" | 1,500 | 35 ft. or 2.5 stories | |
| Lake Forest | 31 | 716 | "B2" Business | 1,500 | 50 ft. or 3 stories | |
| Oak Park (1947) |
9 | 13,085 | "G" | 350 | 80 ft. or 6 stories | |
| "F" | 600 | 45 ft. or 3 stories | ||||
| "E" | 1,000 | 35 ft. or 2.5 stories | ||||
| Maywood (1952) |
11 | 10,501 | "C" | 750 | 45 ft. or 3 stories | |
| Bellwood (1959) |
13 | 8,567 | Apartment District | 780 | 30 ft. or 3 stories | |
| Elmhurst (1955) |
17 | 5,749 | "B" | 1,200 | 35 ft. or 2.5 stories | |
| Villa Park (1942) |
19 | 6,342 | Apartment District | 900 | 45 ft. or 3 stories | |
| Lombard (1960) |
21 | 4,329 | R4 | 2,100 more for extra bedrooms | 35 ft. or 3 stories | .6 |
| Wheaton (1951, as amended) |
26 | 5,515 | Apartment District | 900 | 40 ft. | |
| Yards | |||||
| City or Village (Date of Ordinance) |
Front (% is per cent of lot depth) | Side (excludes corner lot provisions) | Rear (% is per cent of lot depth) |
Parking (Spaces per D.U.) | Other regulations |
| Chicago (1957) |
15 ft. or 12% | None or 8 ft. | 30 ft. | .6 | Min. lot area: 77800 sq.ft. |
| " | " | " | " | " | |
| " | " | " | .75 | " | |
| " | " | " | " | " | |
| " | " | " | " | ||
| " | Greater of: 5 ft. 1/5 height 1/10 front | 1.0 | |||
NORTH SHORE SECTOR |
|||||
| Evanston (Proposed 1958) |
15 ft. | 5 ft. | 25 ft. | 1.0 | |
| 20 ft. | " | " | " | ||
| 27 ft. | " | " | " | ||
| " | " | 30 ft. | " | ||
| Wilmette (Proposed 1959) |
25 ft. | 5 ft. or 10% | 50 ft. | 1.5 | Coverage: 25%. Lot width: 60 ft. |
| Kennilworth | None | None or 5 ft. | |||
| Winnetka (1942) |
30 ft. | 6 ft. | 10 ft. or 15% | Courts: Outer Inner | |
| Glencoe (1959) |
30 ft. | 5 ft. or total of 25% of lot width to 25 ft. | 10 ft. or 25% | 1.5 | Courts: Inner Outer Lot width: 50 ft. |
| 25 ft. | 5 ft. | 10 ft. or 10% | Courts: Inner Outer | ||
| Highland Park (1947, as amended) |
25 ft. | 5 ft. | Lesser: 25 ft. or 20% | 1.0 | Min. lot area. 6000 sq. ft. Lot width: 50 ft. |
| Lake Forest | None | 6 ft. 16 ft. total | 35 ft. | 1.0 | |
| Oak Park (1947) |
15 ft. | 5 ft. plus 2 ft. per story over third | Lesser: 25 ft. or 20% plus 2 ft. per story over third | .5 .333 buildings over 3 stories |
|
| 15 ft. | 5 ft. | Lesser: 25 ft. or 20% plus 5 ft. over story over 2.5 | .5 | ||
| 25 ft. | 5 ft. | Lesser: 25 ft. or 20% | .5 | ||
| Maywood (1952) |
25 ft. | 5 ft. 8 ft. for 3 stories | Lesser: 25 ft. or 20% | .5 | |
| Bellwood (1959) |
15 ft. or 15% | 3 ft. 8 ft. total | 10 ft. or 15% | 1.0 | Coverage: 40% Courts: Inner Outer |
| Elmhurst (1955) |
25 ft. | 5 ft. | 20 ft. or 20% | 1.0 | Coverage: 60% Courts: Inner Outer |
| Villa Park (1942) |
20 ft. | 5 ft. | 20 ft. | .5 | |
| Lombard (1960) |
30 ft. | 6 ft. 16 ft. total |
30 ft. | 1.0 | |
| Wheaton (1951, as amended) |
15 ft. | 6 ft. | 10 ft. | Coverage 40% | |

Base map prepared by Northeastern Illinois Metropolitan Area Planning Commission
Endnotes
1. See note, Seymour I. Toll, "Zoning for Amenities," Low and Contemporary Problems. Duke University, Durham, N.C., Vol. 20, No. 2, p. 279. Spring 1955.
2. The New York City formula is based on several unusual definitions.
The "height factor" of a building is equal to the total floor area of a building divided by its lot coverage. Accordingly, it can differ from the height of the building in stories unless every floor is equal in area.
"Open space" is that part of a zoning lot, including courts and yards, which a) is open and unobstructed from its lowest level to the sky, except as otherwise provided, b) is accessible to and useable by all persons occupying a rooming or dwelling unit on the zoning lot, and c) is not part of the roof of the building, subject to limited exceptions.
"Floor area ratio" is the total floor area on a zoning lot, divided by the lot area.
The "open space ratio" of a zoning lot is the number of square feet of open space on zoning lot, expressed as a percentage of the floor area on the lot. For example, if there were a building with 20,000 square feet of floor area on a zoning lot with 4,000 square feet of open space, the open space ratio would be 20 (per cent).
In the R5, R6, R7, R8 and R9 districts, the relationship between floor area ratio, open space ratio, and height factor is given by the following formula:

Bibliography
American Council to Improve Our Neighborhoods. Rental Housing: Opportunities for Private Investment. New York, N.Y.: McGraw-Hill Book Co. 1958.
American Public Health Association, Committee on the Hygiene of Housing. Planning the Neighborhood. Chicago, Ill.: Public Administration Service. 1960.
"Apartments ... a boom in the Upper Brackets," Architectural Forum, May 1960.
Apartments and Dormitories. New York, N.Y.: F.W. Dodge Corp. 1958.
Apartments and Their Impact on the Public Elementary Schools in the Maryland-Washington Regional District of Montgomery and Prince George's Counties, Maryland. Maryland-National Capital Park and Planning Commission, Silver Spring, Md. Technical Bulletin No. 10. June 1959.
Beyer, Glenn H. Housing: A Factual Analysis. New York, N.Y.: Macmillan Co. 1958.
"Building Good New Apartments is Just About the Best and Easiest Way Anyone With Money Can Make More Money," House and Home, October 1960.
"The Case for the Row House," House and Home, July 1955.
"A Critique, Multi-Family Housing," Progressive Architecture, July 1947.
The Density of Residential Areas. Ministry of Housing and Local Government, London, American Agents; British Information Services, 30 Rockefeller Plaza, New York, N.Y. 1952.
Economic Study of the Cost of Government Compared with Property Tax Income in Relation to Classified Property Uses. Planning and Zoning Commission, Greenwich, Conn. 1954.
"High Apartments or Low," Architectural Forum, January 1952.
''High Rise versus Low Rise," Journal of Housing, July 1952.
Housing and Home Finance Agency. Housing Market Analysis, A Study of Theory and Methods. Washington, D.C.: Government Printing Office. 1953.
———. Know Your Local Housing Market. Ibid. 1956.
———. Thirteenth Annual Report. Ibid.
Kennedy, Robert W. The House and the Art of its Design. New York, N.Y.: Reinhold Publishing Corp. 1953.
Klaber, Eugene Henry. Housing Design. New York, N.Y.: Reinhold Publishing Corp. 1954.
Land Use and Municipal Finance. Town Plan and Zoning Commission, West Hartford, Conn. 1960.
Ministry of Housing and Local Government. Flats and Houses, 1958 Design and Economy. London, England: Her Majesty's Stationery Office. 1958.
"Residential Densities," Planning 1957. American Society of Planning Officials. 1957.
Residential Zoning. City of Toronto Planning Board. Toronto, Ontario, Canada. 1956.
Senning, John. "L.A. Builder Starts FHA's Biggest Renewal project — With No Subsidies," House and Home, September 1960.
A Statement of the Standards of Population Density and Building Coverage. Sacramento City Planning Commission, Sacramento, Calif. August 1956.
Stein, Clarence S. "Multi-Family Housing, Communities for the Good Life," Architectural Record, August 1956.
U.S. Department of Commerce. Characteristics of the 1956 Inventory, United States and Regions. Washington, D.C.: Bureau of the Census. 1959.
———. Components of Change 1950 to 1956, United States and Regions. Ibid. 1958.
"Vacancies Soar in Some Cities but the Boom Rolls Right on," House and Home, June 1960.
Winnick, Louis and Shilling, Ned, for Social Science Research Council. American Housing and its Use, The Demand for Shelter Space. New York, N.Y.: John Wiley & Sons. 1957.
Yorke, F.R.S. and Gibberd, Frederick. Masterworks of International Apartment Building Design. New York, N.Y.: Frederick A. Praeger. 1958.ning Density Study. Report No.1, Analysis of Zoning Regulations in Ten Selected American Cities. Report No.4, The Re1ationship of Building Height, Density and Coverage. Berkeley Planning Department, 215 City Hall, Berkeley, Calif.
Copyright, American Society of Planning Officials, 1960.