


Organization Charting
PAS Report 69
Historic PAS Report Series
Welcome to the American Planning Association's historical archive of PAS Reports from the 1950s and 1960s, offering glimpses into planning issues of yesteryear.
Use the search above to find current APA content on planning topics and trends of today.

|
AMERICAN SOCIETY OF PLANNING OFFICIALS 1313 EAST 60TH STREET — CHICAGO 37 ILLINOIS |
|
| Information Report No. 69 | December 1954 |
Organization Charting
Download original report (pdf)
A chart is a form of visual communication. It describes by the use of symbols a system of relationships. An organization chart graphically portrays a plan of organization. Its chief purpose is to aid in securing a clear-cut understanding of a plan of organization by those who are affected by that organization.
Ardent proponents of organization charting are apt to become fascinated with the proliferation of boxes and lines that the organization chart is capable of embracing. Its skeptical opponents claim that the organization chart is a beguiling picture of something that doesn't exist in real life and protest that the appearance of logic and neatness will be accepted at face value. To both camps we are indebted for a system of reasonable organization charting. To the advocates for the development of principles of charting and a methodology: to the critics for the grain of salt and the constant warning that "the map is not the territory."
Value of Organization Charting
An organization chart is essentially an abstraction. It is a condensation of the structural aspect of a complex institution — a branch of government or a corporation, as the case may be. Being an abstraction, it presents an over-all picture of organizational structure. This is the first use of the chart: to make it possible to see organizational structure as a whole.
Moving on to internal relations — the relation of parts to the whole and to each other — the first value of a chart is that it clarifies. Clarification results (or should result) from any process of classification. But the uniqueness of the classification that constitutes an organization chart is due to the facts that (1) it is two-dimensional, and relative position as well as departmental breakdown is revealed, and (2) symbols are used instead of words so that the picture of organization is visual rather than verbal.
When organizational structure is thus classified and described, what then are some of the practical uses of the organization chart? For one thing, it can be used to discover organizational weakness and inefficiencies, such as duplication of functions, confused channels of authority and responsibility, and inappropriate distribution of personnel. Sometimes the very act of making a chart will reveal confusion about lines of authority and job duties. Organization charting, therefore, goes hand in hand with job description and job classification.
The need for organization charting in a large organization is more immediately apparent than in a small one. Without an organization chart (which, incidentally, need not necessarily be published) it is almost impossible to control personnel costs and recruitment. For the same reason, however, the unique analysis of structure made possible by the organization chart is valuable in smaller staffs as well, particularly those that are expanding in work load and personnel.
Small staffs usually function informally, and formal structural analysis is not necessary because both functions and relationships are understood by everyone concerned. Furthermore, jobs in small staffs are not rigidly defined; and new duties that come into existence are allocated partially on the basis of individual capabilities. However, with all expanding staffs there comes a time for soul-searching, a time for appraisal of the job primarily on its own merits rather than primarily on the merits of the particular person performing it.
Finally, the organization chart is almost indispensable to reorganization. When used for this purpose, it is the beginning of organization planning rather than the end product. In this respect it is analogous to the survey of existing land uses that normally precedes the land-use plan.
One warning should be voiced here. An organization chart is a picture of something that exists. To make a chart before personnel are hired is to make an abstraction of an imaginary institution. While it may be thought desirable on occasion to chart prior to fact, such a picture should be drawn tentatively and only after duties and responsibilities of organizational subdivisions and individual positions are pretty well thought out.
Chart Types
It is generally agreed that organization charts can be classified into four basic types, the first three of which describe organizational setup, the fourth showing sequence in time or process.
1. Structural Chart. Sometimes called a departmental chart, this chart shows the anatomy of the organization. It reveals the basic relationships between the various parts of the organization. Strictly speaking, the structural chart contains no information that would distract from communication of its main purpose — that of displaying structure.
2. Functional Chart. The configuration of the functional chart is identical with that of the structural chart, but it also contains descriptions of the specialized work done by segments of the organization. A statement of duties or functions is placed within each appropriate box.
Functional statements should be clearly stated, as all-inclusive as possible, and should be placed in the present tense to eliminate unnecessary words. Functions common to all divisions shown on the chart should be omitted.
3. Position or Personnel Chart. Here "position" is used as a dignified version of "job." Again, the specific information needed is superimposed on a structural chart. Positions are indicated by job title, and their placement within boxes shows how they fit into the plan of organization.
4. Flow or Process Chart. Strictly speaking, the flow chart is not an organizational chart, but is a detailed record of the successive steps taken by organizational subdivisions in processing their work. It shows the course or channel through which work flows, and may be used to analyze the flow of work and to subsequently rearrange it or to eliminate needless effort. The flow chart is uncommon in planning agencies, and unless work is characterized by a great number of routine operations, this type of chart does not serve a useful purpose.
In practice, planning agencies often find combination charts to be more useful for their purposes than a separate analysis for structure, function, and position. The combining of chart types is more apt to occur where the organization is simple or the staff is small. Sometimes a structural chart is accompanied by a statement of functions. This statement may be detailed and rather lengthy, constituting a compilation of job descriptions, or it may be brief enough to be placed on one page with the chart.
Early in the process of organization charting for a planning agency, a decision will be made on the level of authority to be first represented. Some charts (as will be seen in examples shown later) start with the electorate. Others start with the governmental body or office to which the planning organization is responsible. A few describe only the internal organization of the planning commission itself.
Because the planning agency is not an autonomous governmental unit but one that functions within the formal framework of municipal or county government, the relation of the commission and the director to the rest of the city government sometimes is shown. Where it is desired to emphasize the relation of the planning agency to the voters, via the legislative or executive branch as the case may be, then this relationship can also be indicated on the chart. There are no rules on these matters, however, and the choice of level to be first represented will depend on the complexity of the city government, how firmly the planning function is established, to some extent on the degree to which the planning agency has become an administrative branch of local government, and the purpose for which the chart is made.
Figure 1 is a simplified composite of the three different kinds of organizational charts. The top three levels are structural; the third level contains a structural box, a functional box, and a position box, all representing the same departmental subsection so that comparisons can be made between the kinds of information shown on the three different charts.
Figure 1. Types of Organizational Charts

Principles of Charting
Authorities agree that organization charts should have the appearance of symmetry, simplicity, and unity. Symmetry is one of the ways of showing the logic of the organizational structure. Sometimes chart makers are tempted to route connecting lines along an indirect instead of direct path in order to get the entire chart on a sheet of a specified size. This results in a confused picture of the organizational structure and in part nullifies the purpose of the chart. Equally misleading, however, is an artificial forcing of symmetry. Most organizations inherently possess symmetry — and this should be reflected in the chart.
The rule of simplicity applies to the symbolic elements of the chart as well as the over-all arrangement. One charting expert has observed that a complicated or confused chart is a sign that the plan of organization itself is complicated or confused, or that the charting technique is improper.
Unity applies chiefly to the arrangement of chart components on the paper. Compactness, coherence, emphasis of major lines of authority and responsibility, use of consistent boxes (rectangles and squares instead of combining rectangles with circles, triangles and ovals) all contribute to an effect of unity.
Chart Components
The two essential parts of a chart are the boxes and the lines connecting them. Different kinds of relationships are shown by box positions, kinds of lines, and the use of special designating symbols. The possibilities of variation are almost endless.* However, solid connecting lines and solid-line boxes are adequate for most purposes.
The general rule is that solid lines indicate authority and responsibility, and that dotted lines indicate relationships of particular importance where it is designed to emphasize those relationships. One authority holds that dotted lines should not be used to indicate routine day-to-day working relationships. Another authority, however, has developed several kinds of broken lines to show flow of work, advice, and "funneling of instructions." Both infer that dotted lines should be used sparingly.
In an article on organization charts in a British governmental bulletin it is observed that "the lines joining the various officers have a meaning which involves some degree of action; in some respects they correspond to verbs where words are concerned." In several of the organization charts shown at the end of this Information Report the verbs which the lines represent are themselves placed on the chart.
Certain charting practices are so widely followed as to have become nearly standardized. These practices are illustrated in Figure 2.
Other matters of information that should appear on the face of the chart are:
1. Title: city or county, planning agency, and kind of chart
2. Date
3. Legend or key explaining meanings of special lines, boxes, and symbols
Where organization charts are contained in annual reports of city or county agencies, titles are often abbreviated and the date is not always indicated.

Figure 2. Diagram of Standard Charting Practices
2. S is a staff position, possessing no authority.
3. Advisory bodies are indicated by the use of the separate "side arm," a horizontal line proceeding from the side of the box.
(Note that horizontal lines emerging from vertical lines — e. g., the horizontal line connecting C -1 and C -3 to vertical line BC — do not indicate an advisory relationship.)
Some of the pitfalls of organization charting have been mentioned in different parts of this report, but one danger needs especially to be emphasized. This is the danger of the misuse of solid, vertical lines. It should be kept in mind that solid, vertical lines stand for authority and responsibility; they never merely connect positions in a hierarchy unless that connection bears authority. Misuse of the solid, vertical line is most likely to occur in a position chart or in a combined structural-position chart. Figure 3 illustrates (A) the right and (B) the wrong way of indicating that the entire planning section is responsible to the planning director. (B) would not be incorrect if authority actually flowed from one position (or level) to the other.
Figure 3. Right and Wrong Ways of Indicating Authority

Examples of Organizational Charts for Planning Agencies
The balance of this report consists of a group of organization charts taken for the most part from annual reports of various city and county planning agencies. There is some spread in population size, but most cities and counties represented are over 100,000.
All three types of charts — structural, functional, and position — are to be found in this group, either singly or in combination. Strictly speaking, there are no flow charts. Although some examples do designate the nature of the relationship between organizational subdivisions by using such words as "assist," "coordinate," "elect," and "appoint," this is something different from the detailed analysis of routine operations that the typical flow chart describes. The use of arrows and other devices employed in these examples to carry the eye along from one point to another should not be confused with the arrows often used in a flow chart.
The intended distribution of the report in which the organization chart appears will probably affect its form to some extent. If distribution is to be widespread, and among the recipients is a number of persons not familiar with planning organization and function, then the use of graphic elements may well add to the comprehensibility of the chart and an understanding of the position of planning in local government.
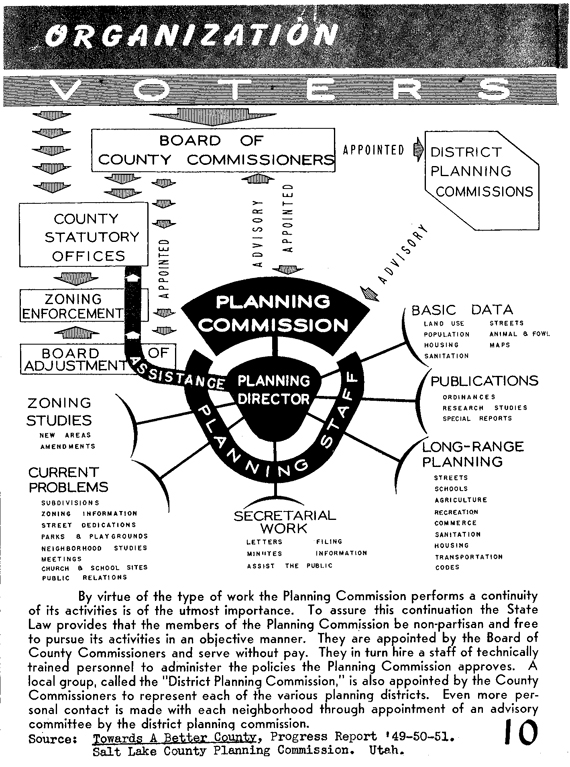
In the charts describing the planning commissions of Delaware County, Pennsylvania, and Salt Lake County, Utah, emphasis is placed on the fact that the voters elect the county boards who, in turn, appoint the planning commissions. Also emphasized in these two charts are the kinds of things done by the commissions and the nature (by means of words) of the relationships between various branches.
Several conventional organization charts are among this group. Although among them are examples embodying the principles of charting (symmetry, simplicity, and unity) and others showing proper arrangement of chart components, no one can be singled out as a model.
In between the graphic organization charts of Delaware and Salt Lake counties and the several conventional organization charts are other examples that embody features of both. Many of the charts are combination charts, the most frequent being structural and position, and one (Seattle) being structural, position, and functional.
Several generalizations can be drawn from this group of charts. The first — a rather obvious one — is that the larger the staff, the more complex the structure and the more specialized the individual functions. Notice, however, that it is not always possible to be sure that valid inferences regarding complexity and specialization are being drawn from a comparison of two or more charts. A case at point is The Regional Planning Commission of Los Angeles County and the City Planning Commission of Los Angeles. According to the 1954 Municipal Yearbook, Los Angeles County Regional Planning Commission employs 90 full-time persons and the Los Angeles City Planning Commission employs 70 full-time persons. They are comparable in staff size. Judging from the organization charts alone, the city commission appears to be vastly simpler than the county commission. But this is not necessarily the case because (1) the charts are different types, the city chart being structural (with functional explanations in accompanying text), and the county chart being position; (2) the city chart represents a higher level of abstraction than the county chart.
A second generalization that can be drawn from this group of charts is that there appears to be a fairly consistent dichotomy between planning and administration.
Sometimes the zoning functions appear entirely in an administrative category, sometimes they constitute an individual section, and sometimes zoning activities are split between planning and administration. A third generalization, then, is the tendency to separate the planning and zoning functions, either within a major organizational subdivision, or into entirely different categories.


Source: Annual Report of the Planning Division, Fiscal Year 1952–1953. Glendale, California.

Source: Planning Progress, Annual Report of the City of Seattle City Planning Commission. Washington.

Source: Annual Review 1953. Board of Public Land Commissioners, Milwaukee, Wisconsin.

Source: Annual Report 1952–1953. City Planning Commission, Oakland, California.

Source: Accomplishments 1953. City Planning Commission, Los Angeles, California.

*A manual by John J. Furia on How to Make and Interpret Functional Organization Charts (Public Business Management Series No. 2, 1943. 64 pp.) explains in considerable detail the various devices that can be used to illustrate special relationships, e. g., temporary subdivisions, part-time assistance, flow of advice, etc. Distributed by the New York University Bookstore. Price 50¢.
Copyright, American Society of Planning Officials, 1954.