2025 Planners' Salary and Benefits Survey

Sources for illustration: Natalia Arsenova, jemastock, VeraMakeeva, Pikusisi-Studio/iStock/Getty Images Plus. Illustration by Catherine Bixler
APA’s 2025 Planners’ Salary and Benefits Survey presents an up-to-date, multidimensional snapshot of the state of the planning profession, with respect to the personal characteristics of planners, the organizational characteristics of their employers, levels of compensation, and range of benefits.
This page presents a high-level summary of the survey and its results. All APA members have access to the full survey results, and nonmembers can purchase access for $349.
About the Survey
For more than 75 years, APA has periodically provided information on planning position salaries. Typically, APA collected this information through mail and, eventually, online surveys of its membership. For the 2025 Planners’ Salary and Benefits Survey, APA invited all self-identified planners (regardless of their membership status) to complete its online survey.
APA launched the survey on February 1, 2025, and collected responses through February 28. It sent invitations through multiple channels, including direct emails to current and former APA members and organic and paid social media campaigns, to reach the broadest possible audience of planning professionals.
The survey instrument included questions about respondents’ employment status and situation, compensation and benefits, workplace characteristics, educational and professional experiences, and basic demographic information. While many of these questions had parallels to those asked in previous salary surveys, APA targeted a broader audience in 2025. Consequently, this report does not compare results to earlier efforts. Instead, it briefly highlights results from recent federal data collection efforts that may help contextualize the 2025 survey responses.
In total, APA received 6,747 valid responses. Unless otherwise noted, the following analysis focuses on the 6,374 respondents who indicated that they were currently employed (or self-employed) and working in the U.S. However, the full report of survey results includes a brief appendix with descriptive statistics about respondents who said they were students, retired, not currently employed, or employed outside of the U.S.
While this survey achieved broad participation across the planning profession, all voluntary-response surveys may be subject to self-selection bias. Readers should interpret these results as representative of the survey respondents and not necessarily of the entire profession.
Key Findings
- The median annual salary for respondents working full-time, throughout the year, was $98,000.
- American Institute of Certified Planners (AICP) respondents earned 31 percent more, on average, than non-AICP respondents.
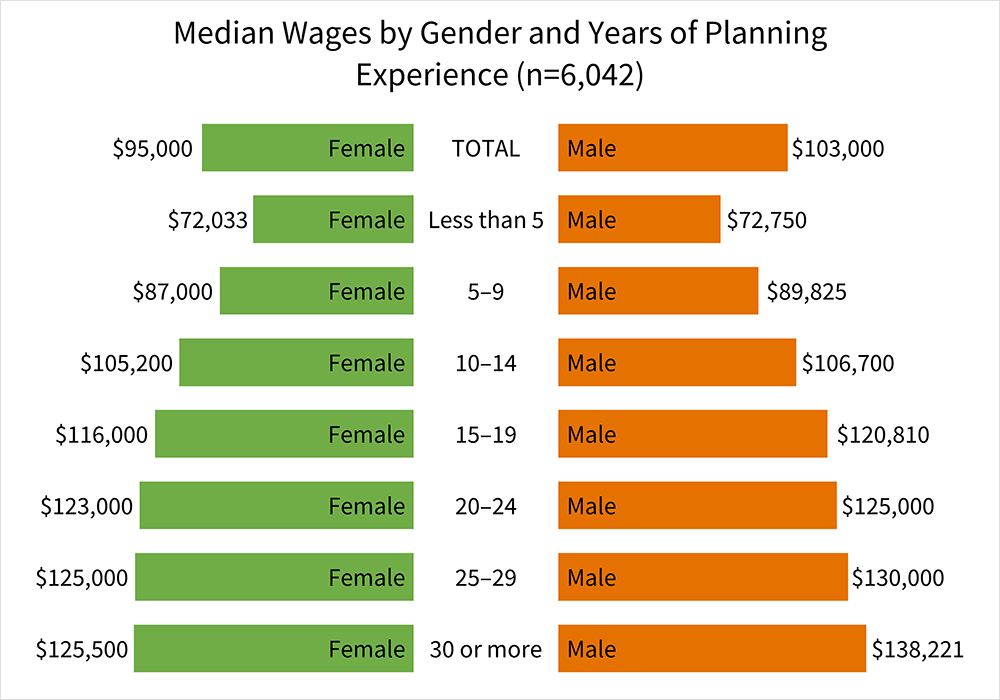
- Female respondents earned 9 percent less, on average, than male respondents.
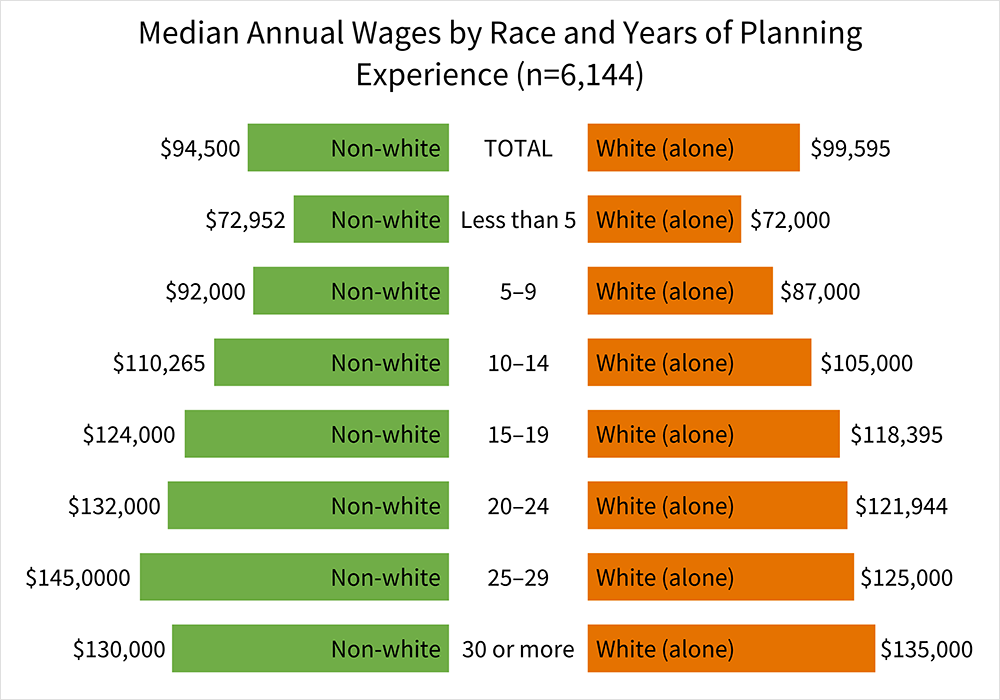
- Non-white respondents earned 4 percent less, on average, than white respondents.
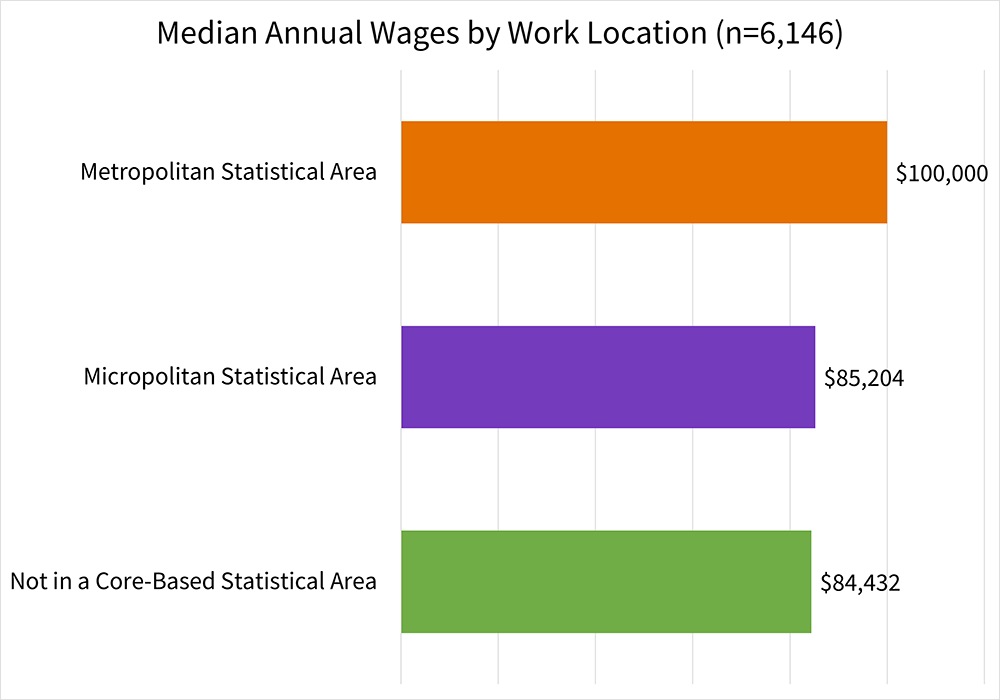
- Respondents working in metropolitan statistical areas (MSAs) earned 15 percent more, on average, than those working outside of MSAs
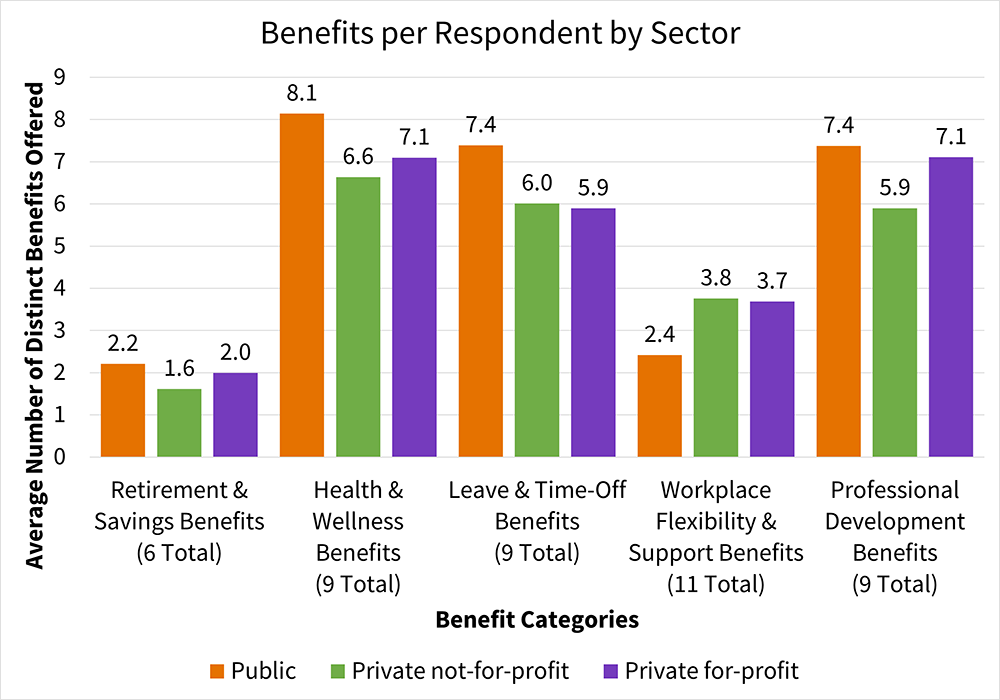
- Respondents working in the private sector earned 12 percent more, on average, than those working in the public sector, while public-sector respondents reported having more comprehensive benefits packages.
Respondent Profile
The typical (median) employed (or self-employed) U.S.-based respondent is 40 years old, has been in the planning profession for 11 years, and has been in their current position for 3 years.
A slight majority of these planners identified as female (51 percent), and a large majority identified as white (80 percent).
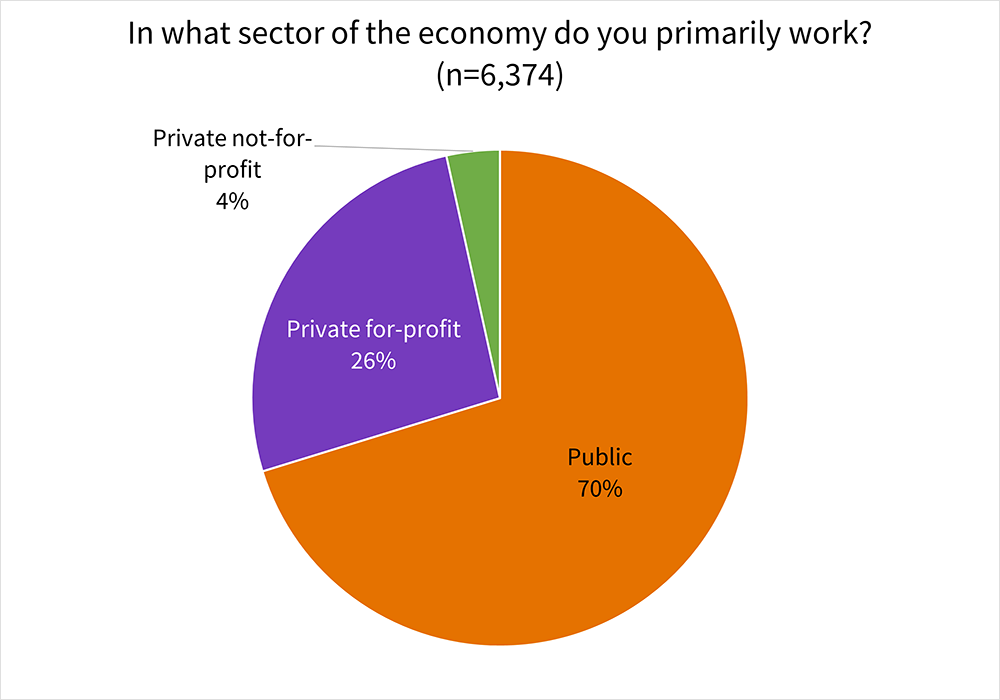
70 percent of respondents worked for public entities, while 26 percent worked for private for-profit entities and 4 percent worked for private not-for-profit entities.
91 percent of respondents reported their principal place of employment was in an MSA, while 6 percent work in micropolitan statistical areas and 3 percent work outside of core-based statistical areas defined by the U.S. Office of Management and Budget.
![What is your primary work location? (2025 Planners' Salary and Benefits Survey) What is your primary work location? [By Core-Based Statistical Area Type] (n=6,351): Metropolitan Statistical Area: 91%; Micropolitan Statistical Area: 6%; Not in a Core-Based Statistical Area: 3%.](https://planning-org-uploaded-media.s3.amazonaws.com/image/e68c471c-1da3-4da5-ad82-ee287e950278work-location-by-cbsa-type.png)
Compensation
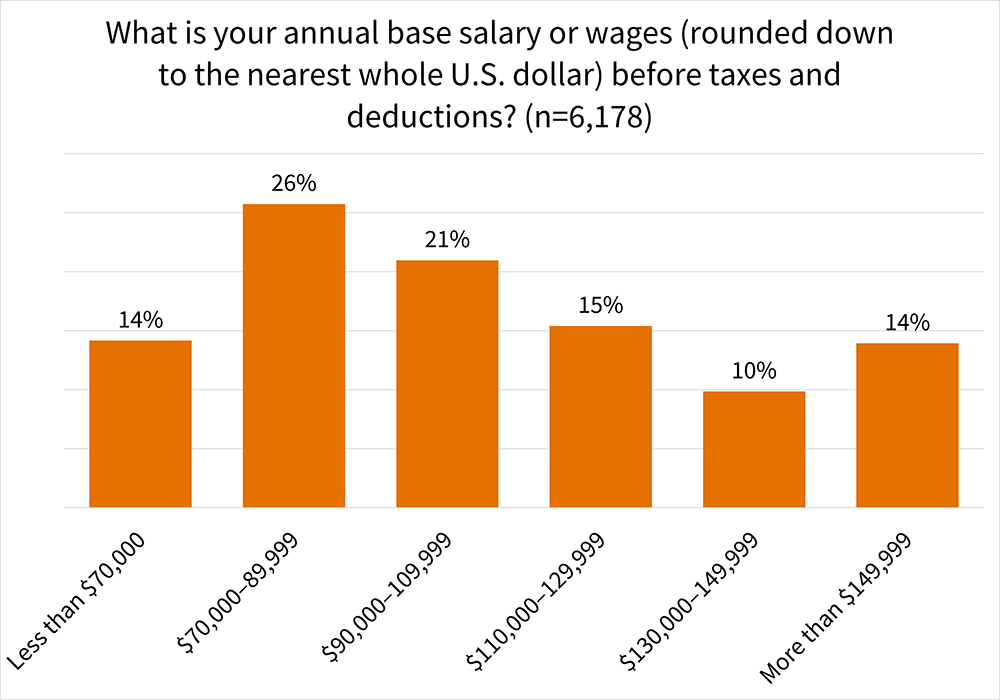
The typical (median) full-time employed U.S.-based respondent reported an annual base salary of $98,000, which is equivalent to a base hourly rate of $47.12 (assuming a standard 40-hour work week).
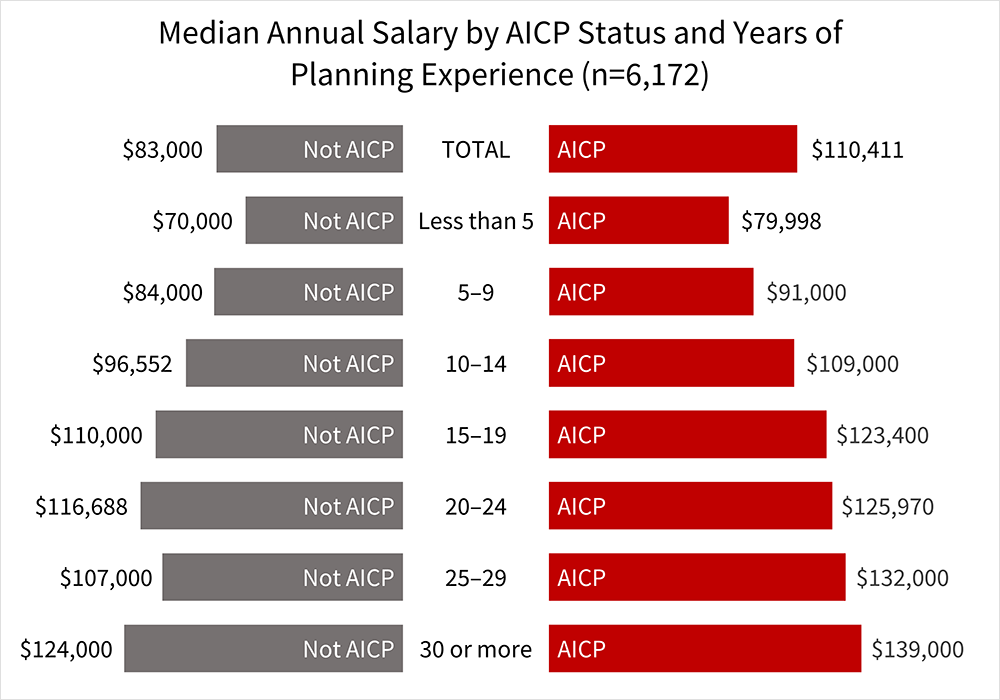
AICP respondents earned 31 percent more annually, on average, than those without AICP certification. While the salary gap narrowed as planning experience increased, typical (median) AICP respondents earned more at every experience level.
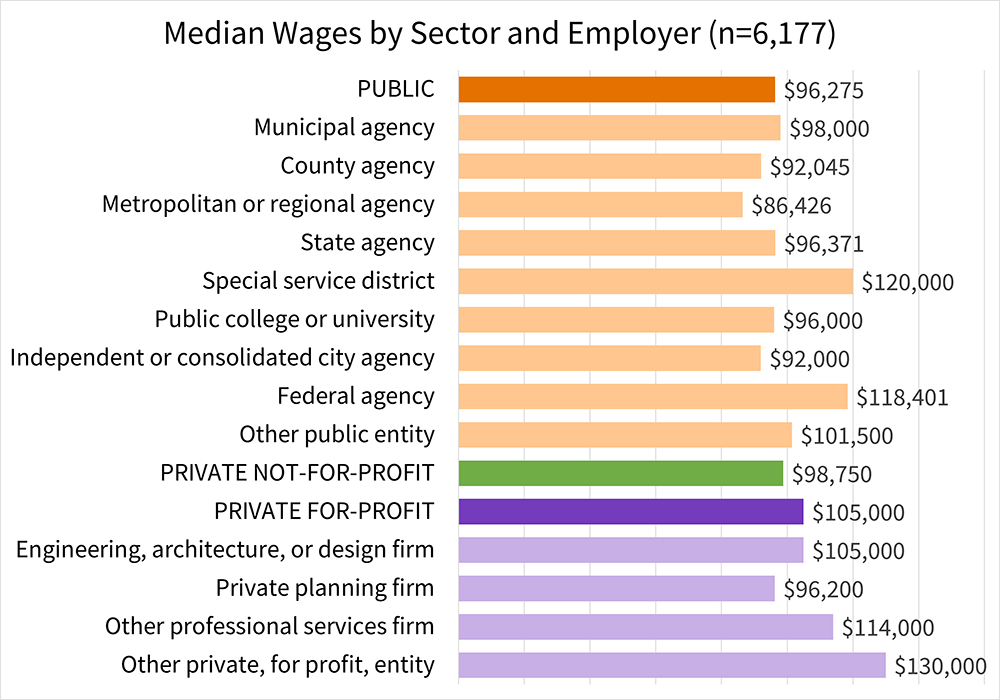
Respondents working for private for-profit entities earned more, on average, than those working for public or not-for-profit entities. However, median wages varied more by employer type than by employment sector.
In general, annual wages were higher in locations with higher costs of living. This is most clear in the wage premium for respondents who work in MSAs versus micropolitan statistical areas or areas outside of MSAs or micropolitan statistical areas.
Female respondents earned 9 percent less, on average, than male respondents. However, this gap is predominantly attributable to differences between respondents with 30 or more years of planning experience.
Non-white respondents earned 4 percent less, on average, than white respondents. However, the typical (median) non-white respondent earned more at every experience level except the 30-or-more-years category. Nevertheless, because the typical (median) white respondent had 12 years of planning experience, compared to 8 years for non-white respondents, white respondents had a higher aggregate median annual wage.
Benefits
Respondents working in all sectors reported having access to extensive benefit packages. Public-sector planners, on average, had access to a larger number of retirement and savings, health and wellness, leave and time-off, and professional development benefits than private-sector planners. However, private-sector respondents reported more workplace flexibility and support benefits.
Full Survey Results
APA Members
APA members can access the full survey results from the section links below.
Nonmembers
Nonmembers can purchase access for $349. After purchasing, nonmembers can access the full results from the links above.


